Fertilizer Sector 1Q26 Earnings: Implications for Food & Beverage Companies
Written by

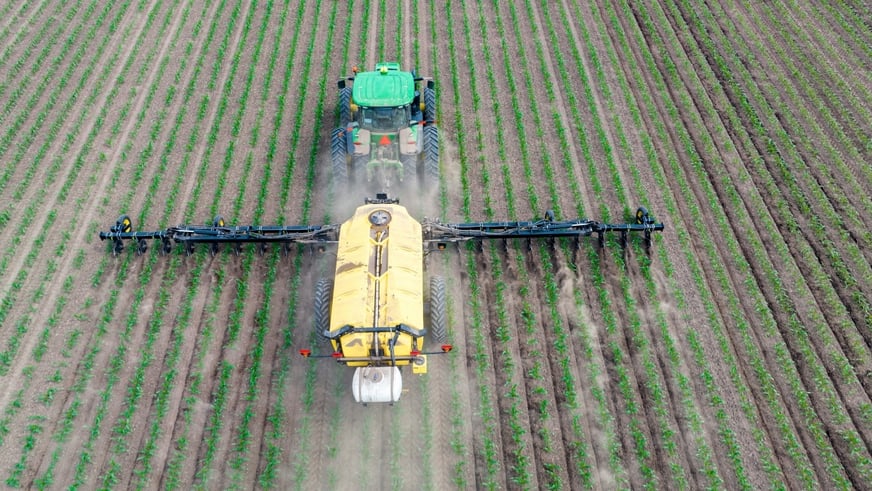
1Q26 earnings across the global Fertilizer sector offered some crucial forward-looking signals for downstream Food & Beverage producers. As the conflict in the Middle East intensifies again and disrupts key trade routes, it's worth taking a closer look at the resulting impacts to the fertilizer sector that can significantly shape downstream inflation pressures and margin stability. In our latest analytical long-read from Cognitive Credit AI, we break down key 1Q26 takeaways and the knock-on credit implications for Food & Beverage issuers moving forward.
The 1Q26 earnings season for fertilizer companies paints a challenging picture for the agricultural supply chain, with significant knock-on implications for food & beverage companies. The dominant theme is a structural supply shock driven by the Middle East conflict and Strait of Hormuz disruption, which has driven nitrogen and phosphate prices to multi-year highs. This is compounding existing pressures on farmer economics, threatening crop yields in key producing regions, and creating a medium-term risk of elevated agricultural commodity prices — a key input cost for food & beverage companies.
The Root Cause: Geopolitical Supply Shock
All seven companies — CF Industries, Nutrien, Mosaic, Yara, K+S, CVR Partners, and Corteva — referenced the Middle East conflict and Strait of Hormuz closure as the primary market disruptor:
- ~30% of global urea trade, ~25% of ammonia, and ~25% of phosphate normally transits through the Strait of Hormuz (Nutrien, CVR Partners)
- Multiple nitrogen fertilizer production facilities across the Middle East have been damaged or curtailed due to limited natural gas supplies
- Qatar's LNG facility has suffered a ~20% capacity loss, with a 3–5 year repair timeline (Nutrien)
- Sulfur stranding — a key input for phosphate fertilizer — is severely limiting phosphate production globally (Mosaic, Yara)
- European natural gas prices have risen to ~$14–$16/MMBtu, keeping European nitrogen production well below historical levels (CVR Partners, Yara)
Fertilizer Price Inflation: Magnitude and Duration
|
Nutrient |
Price Level / Change |
Source |
|
Urea (India tenders) |
~$950/tonne |
Yara |
|
Urea (North Africa) |
$800–$850+/tonne |
CF Industries |
|
Urea (U.S. Gulf) |
$600–$660/tonne |
CF Industries |
|
UAN (U.S.) |
~$343/tonne (+34% YoY) |
CVR Partners |
|
Ammonia (U.S.) |
~$687/tonne (+24% YoY) |
CVR Partners |
|
Sulfur |
~$1,200/unit |
Mosaic |
Duration: CF Industries and Nutrien both expect nitrogen markets to remain tight through 2026 and into 2027, with normalization contingent on: (1) Strait of Hormuz reopening, (2) restart of Middle East production, and (3) assessment of infrastructure damage. Mosaic expects phosphate stripping margins to remain compressed through Q3–Q4 2026 given further anticipated sulfur price increases.
Export restrictions are amplifying the supply squeeze:
- China restricting urea exports to ~3–4 million tonnes (vs. 5 million tonnes in 2025)
- Russia prioritising domestic agriculture
- Egypt applying a $90/tonne duty on nitrogen fertilizer exports
Farmer Economics Under Stress — The Transmission Mechanism
The key transmission mechanism to food & beverage companies runs through farmer economics and crop yields:
Nutrient Under-Application Risk
- Mosaic's CEO described a situation where "rarely, if ever, have we seen where stripping margins on the phosphate producer side are this compressed and farmer affordability at the same time being distressed"
- Reduced fertilizer applications in fall 2025 and spring 2026 are expected to have significant yield impacts on future crops (Mosaic)
- Yara noted farmers are skipping topping applications and deferring purchases to manage cash flow
- Corteva flagged that in Brazil, nitrogen cost inflation is making soybeans more economically favourable relative to corn, with safrinha (second crop) area at risk
Regional Divergence
- North America: Farmers largely pre-secured fertilizer earlier in the year at lower prices; spring planting is proceeding relatively normally (~95M acres corn, ~85M acres soybeans). Nitrogen is described as a nutrient farmers "really can't skip on" (CF Industries)
- Latin America / Brazil: Higher risk of under-application, particularly for phosphate and nitrogen; working capital and credit availability are emerging concerns (Corteva, Mosaic)
- Africa / South Asia: Demand destruction is more acute; governments in India, Pakistan, and Ethiopia are providing subsidies to support farmer purchasing (Mosaic)
Grain & Commodity Price Response
- Corn prices have strengthened to ~$5/bushel for December delivery; soybeans at ~$11.90/bushel (Nutrien, CVR Partners)
- Mosaic noted global grain and oilseed stock-to-use ratios are not in crisis mode today, but only a 2–3% disruption is needed to create stress
- CF Industries expects lower fertilizer consumption in Latin America, Africa, and Southeast Asia to result in declining crop yields and higher prices for corn, wheat, rice, cotton, and sugar
Direct Implications for Food & Beverage Companies
A. Agricultural Raw Material Cost Inflation (Near-to-Medium Term)
- Elevated fertilizer costs flowing through to higher crop production costs will put upward pressure on agricultural commodity prices — the primary raw material input for food & beverage companies
- Grains (corn, wheat), oilseeds (soybeans), sugar, and cotton are all flagged as at risk of price increases (CF Industries)
- The effect is most acute for companies with high exposure to commodity ingredients (e.g., grain-based foods, edible oils, sweeteners, animal feed/protein)
B. Supply Availability Risk
- Nutrient under-application in key growing regions (Brazil, Africa, Southeast Asia) creates a medium-term yield risk that could tighten agricultural commodity supply
- India's urea import requirements are projected at 10–12 million tonnes in 2026 (nearly double 2024 levels), intensifying global competition for available nitrogen supply
- Mosaic's production curtailments in phosphate are a leading indicator of future supply tightness in phosphate-intensive crops (fruits, vegetables, oilseeds)
C. Geographic Sourcing Exposure
- Food & beverage companies with supply chains concentrated in Brazil, Argentina, or the Middle East face heightened risk of input cost volatility and potential yield shortfalls
- Companies sourcing from government-subsidised regions (India, parts of Africa) may be partially insulated in the near term
D. Pricing Power and Margin Implications
- The combination of higher agricultural raw material costs and a consumer environment already sensitive to food price inflation creates a margin squeeze risk for food & beverage companies with limited pricing power
- Companies with long-term supply contracts or hedging programmes for agricultural commodities will be better positioned to absorb near-term shocks
E. Crop Protection (Corteva Context)
- Crop protection costs are also rising modestly, with China's VAT export controls causing ~8% price increases on certain active ingredients
- This adds a further layer of input cost pressure on top of fertilizer inflation for farmers, potentially compounding yield risk
Key Risks to Monitor
|
Risk |
Timeframe |
Key Signal |
|
Strait of Hormuz remains closed |
Near-term |
Geopolitical developments |
|
Phosphate supply curtailments deepen |
2Q–3Q 2026 |
Mosaic/Nutrien production updates |
|
Brazil safrinha crop underperformance |
2H 2026 |
USDA crop reports |
|
Grain stock-to-use ratios deteriorate |
2H 2026–2027 |
USDA WASDE reports |
|
China urea export restrictions persist |
2026–2027 |
Chinese export policy |
|
European natural gas prices remain elevated |
Structural |
TTF gas prices |
Summary Assessment
The 1Q26 fertilizer earnings collectively signal that food & beverage companies face a more challenging agricultural commodity cost environment through 2026 and into 2027 than was anticipated at the start of the year. The supply shock is structural in nature (geopolitical + infrastructure damage), not cyclical, and the duration of elevated fertilizer prices is tied to factors outside the industry's control. Food & beverage analysts should focus on: (1) companies' agricultural commodity hedging positions, (2) exposure to at-risk growing regions, and (3) pricing power to pass through higher input costs to consumers.
Note: This analysis is based on management commentary from 1Q26 earnings calls. It reflects forward-looking statements and management views, which are subject to change. This is not investment advice.
Food & Beverage
Companies Most at Risk of Adverse 2Q26 Financial Impact
Cross-referencing the fertilizer sector's 1Q26 earnings (geopolitical supply shock, elevated nitrogen/phosphate/sulfur prices, farmer affordability stress) with 1Q26 earnings commentary and financial results from food & beverage companies, five companies stand out as facing the greatest adverse financial impact in 2Q26: B&G Foods, Dole Plc, General Mills, Nomad Foods, and Ingredion. A further group — Kraft Heinz and Flowers Foods — face meaningful but more manageable headwinds. The common threads are: (1) high unhedged exposure to agricultural commodity inputs, (2) limited near-term pricing power, (3) elevated leverage, and (4) explicit management guidance pointing to Q2 deterioration.
Framework: Three Channels of Impact
The fertilizer shock transmits to food & beverage companies through three channels, each with different timing:
|
Channel |
Timing |
Key Inputs Affected |
|
Direct: Higher crop production costs → higher commodity prices |
Near-term (already flowing) |
Corn, wheat, soybeans, sugar, vegetable oils |
|
Indirect: Farmer under-application → yield shortfalls |
Medium-term (2H26–2027) |
All grain/oilseed crops |
|
Energy/packaging: Higher oil/gas prices → resin, packaging, freight |
Near-term (already flowing) |
Packaging, diesel, logistics |
Tier 1: Highest Risk — Explicit 2Q26 Deterioration Signalled
1. B&G Foods (BGS) — 🔴 Highest Risk
Why it stands out: B&G is the most acutely exposed company in the universe. Soybean oil — the primary cost input for its flagship Crisco brand — has surged ~50% year-over-year to north of $0.70/lb (approaching 2022 peak levels), driven directly by the biofuel/geopolitical dynamic flagged in the fertilizer earnings. The company has taken no pricing action as of 1Q26 and is relying entirely on internal cost savings and productivity to absorb the shock.
Financial profile (1Q26 LTM):
|
Metric |
Value |
|
Company Reported Adjusted EBITDA (1Q26) |
$57.6M |
|
Adjusted EBITDA Margin (1Q26) |
14.1% |
|
LTM Adjusted Net Leverage |
7.2x |
|
LTM Gross Debt |
~$2.0bn |
Key risk factors:
- Soybean oil at ~$0.75/lb vs. ~$0.50/lb a year ago — a ~50% YoY increase with no pricing offset in place
- Adjusted EBITDA already down ~2.5% YoY in 1Q26
- Leverage at 7.2x adjusted net — the highest in the peer group — leaves minimal buffer for further EBITDA compression
- Management explicitly acknowledged the need for industry-wide pricing action on soybean oil but has not yet moved
- Consumer price sensitivity constrains the ability to pass through costs (managing to $5 retail price thresholds)
- Resin/packaging costs also rising due to oil price inflation
2Q26 outlook: Without pricing action, further margin compression is highly likely. The combination of elevated soybean oil costs, high leverage, and no near-term pricing catalyst makes B&G the most vulnerable name in the sector.
2. Dole Plc (DOLE) — 🔴 High Risk
Why it stands out: Dole has the most direct and explicit exposure to the fertilizer/Middle East shock of any company in the universe. As a fresh produce grower and distributor, fertilizer is a direct production input, and the company also faces higher shipping and fuel costs from Strait of Hormuz disruption. Management explicitly guided for Q2 to "suffer quite a few of the costs, particularly in relation to fuel."
Financial profile (1Q26 LTM):
|
Metric |
Value |
|
Company Reported Adjusted EBITDA (1Q26) |
$100.3M |
|
Adjusted EBITDA Margin (1Q26) |
4.3% |
|
LTM Adjusted Net Leverage |
1.7x |
|
LTM Gross Debt |
~$930M |
Key risk factors:
- Fresh Fruit segment costs were "quite elevated" in 1Q26, with higher food sourcing costs driving a $10.7M adjusted EBITDA decline in the division
- Bunker surcharge formula creates a structural one-quarter lag — Q2 will absorb cost increases that cannot be passed through until Q3/Q4
- Management explicitly stated: "Q2 is going to suffer quite a few of the costs, particularly in relation to fuel"
- Fertilizer and packaging costs rising due to Middle East conflict (directly referenced by analyst and confirmed by management)
- Adjusted EBITDA margin is already thin at ~4.3%, leaving little room for cost absorption
- Leverage is relatively modest at 1.7x adjusted net, which provides some balance sheet buffer
2Q26 outlook: Management has guided for a materially weaker Q2, with recovery expected in H2 as pricing adjustments flow through. The structural pricing lag is the key risk — the question is whether cost escalation in Q2 exceeds management's assumptions.
3. General Mills (GIS) — 🟠 High Risk
Why it stands out: Management explicitly guided for Q2 operating profit to decline more significantly than Q1, driven by the unwinding of two timing benefits that flattered 1Q26: (1) lighter-than-expected inflation phasing (~2% vs. 3% annual run rate) and (2) ~$20M international trade expense timing benefit. Both are expected to reverse in Q2, with inflation potentially exceeding the annual run rate.
Financial profile (May fiscal year-end):
|
Metric |
Value |
|
Derived EBITDA (3Q26, latest) |
$664M |
|
LTM Derived EBITDA |
$4,034M |
|
EBITDA Margin (3Q26) |
15.0% |
|
LTM Net Leverage |
3.3x |
|
LTM Gross Debt |
~$14.0bn |
Key risk factors:
- Management guided Q2 operating profit to decline more than Q1, with inflation phasing expected to exceed the annual run rate
- Pricing actions (base shelf price increases across ~two-thirds of portfolio) are being completed in Q2 — but the timing benefit of lower inflation in Q1 will not repeat
- Grain/wheat exposure is significant given the portfolio (cereals, baking, snacks) but specific hedging coverage was not disclosed
- The fertilizer shock's impact on wheat and corn prices is a medium-term risk that could pressure 2H26 and FY27 costs
- Leverage at 3.3x net is manageable but elevated for an IG-rated issuer
2Q26 outlook: Management's own guidance points to a weaker Q2 vs. Q1. The fertilizer-driven commodity cost environment adds a further layer of risk to the back half of the year, particularly for wheat and corn-based inputs.
Tier 2: Meaningful Risk — Manageable But Elevated
4. Nomad Foods (IGBOND) — 🟠 Meaningful Risk
Why it stands out: Nomad has direct exposure to fertilizer and fuel cost inflation through its agricultural and fish supply chains. Management acknowledged fertilizer and fuel costs have moved higher due to geopolitical developments, and explicitly flagged Q2 headwinds from: (1) regional shipment disruption (~a couple of basis points), (2) Easter timing (~0.5%), and (3) elasticity impact from private label pricing lag.
Financial profile (1Q26 LTM):
|
Metric |
Value |
|
Company Reported Adjusted EBITDA (1Q26) |
€92.6M |
|
Adjusted EBITDA Margin (1Q26) |
12.9% |
|
LTM Adjusted Net Leverage |
4.1x |
|
LTM Gross Debt |
~€2.3bn |
Key risk factors:
- Fish costs experiencing "quite a bit of inflation" — fish farming is highly fertilizer/feed-intensive
- Fertilizer and fuel cost increases acknowledged as flowing through COGS, though overall 2026 COGS inflation remains within mid-single-digit guidance
- Leverage at 4.1x adjusted net is elevated for a frozen food business with thin margins
- Management flagged that incremental inflation will roll through the P&L in Q4 2026 and into 2027 if conditions persist — the fertilizer shock could accelerate this timeline
- Adjusted EBITDA already down 22.9% YoY in 1Q26
2Q26 outlook: Management characterised the situation as "eminently manageable" for 2026, but the combination of elevated leverage, thin margins, and acknowledged Q2 headwinds warrants close monitoring. The 2027 risk is more significant.
5. Ingredion (INGR) — 🟠 Meaningful Risk
Why it stands out: Ingredion is a direct corn processor — corn is its primary raw material input. The company revised its full-year 2026 guidance downward to reflect "higher energy prices on input costs and logistics," and guided 2Q26 adjusted operating income down high single digits YoY. The Argo plant operational issues compound the commodity cost headwinds.
Financial profile (1Q26 LTM):
|
Metric |
Value |
|
Derived EBITDA (1Q26) |
$258M |
|
EBITDA Margin (1Q26) |
14.4% |
|
LTM Net Leverage |
0.8x |
|
LTM Gross Debt |
~$1.8bn |
Key risk factors:
- Corn is the primary input; elevated corn prices (driven by fertilizer cost inflation and potential yield shortfalls) are a direct margin headwind
- Derived EBITDA already down 23.4% YoY in 1Q26 — the steepest decline in the peer group
- Management guided 2Q26 adjusted operating income down high single digits YoY
- Full-year adjusted operating income guidance revised to "flat to down low single digits"
- Sweeteners & Starches volumes declined 3% in 1Q26 with margins down more than volume — consumer demand softness compounding cost pressures
- Argo plant operational issues (corn conveying failure, thermal event) add idiosyncratic risk on top of commodity headwinds
Mitigant: Leverage is very low at 0.8x net, providing significant balance sheet resilience.
2Q26 outlook: Explicit management guidance for high single-digit operating income decline in Q2, combined with ongoing corn cost pressures, makes this a clear 2Q26 risk.
6. Kraft Heinz (KHC) — 🟡 Moderate Risk
Why it stands out: Kraft Heinz is experiencing peak commodity inflation across coffee and meat in 1Q26, with energy and resin costs spiking due to geopolitical conflict. The company is well-hedged on energy for the full year and on resins through mid-Q3, but will begin absorbing resin inflation in Q3. The SNAP headwind (100bps starting Q2) and Easter timing (-3% to -5% top line) are the more immediate 2Q26 risks.
Financial profile (1Q26 LTM):
|
Metric |
Value |
|
Derived EBITDA (1Q26) |
$1,403M |
|
EBITDA Margin (1Q26) |
23.2% |
|
LTM Net Leverage |
3.2x |
|
LTM Gross Debt |
~$21.1bn |
Key risk factors:
- Full-year commodity headwind of 25–75bps; energy/resin spike adds to original ~4% inflation guidance
- SNAP headwind of 100bps starting Q2 — a direct volume/revenue risk
- Consumer affordability constraints limit pricing power; company targeting only ~50% cost pass-through via pricing
- Leverage at 3.2x net is elevated given the scale of gross debt (~$21bn)
- Top line guided -3% to -5% in Q2 due to Easter shift
Mitigant: Strong EBITDA margin
7. Flowers Foods (FLO) — 🟡 Moderate Risk
Why it stands out: Flowers is virtually fully hedged on wheat/grain for 2026, which insulates it from the most direct fertilizer-driven commodity risk. However, the company faces unexpected headwinds from oil-derived costs (packaging resins, diesel, transportation) estimated at $0.02–$0.03 per share in H2 2026.
Financial profile (1Q26 LTM):
|
Metric |
Value |
|
Company Reported Adjusted EBITDA (1Q26) |
$159.0M |
|
Adjusted EBITDA Margin (1Q26) |
~10.1% |
|
LTM Adjusted Net Leverage |
3.2x |
|
LTM Gross Debt |
~$1.7bn |
Key risk factors:
- Wheat hedging provides 2026 protection but creates a 2027 cliff risk if fertilizer-driven wheat prices remain elevated
- Oil-derived cost headwinds (packaging, diesel) are the primary near-term risk — not yet in original guidance
- Leverage at 3.2x adjusted net is elevated for a bread/baked goods business with thin margins
- Consumer affordability concerns limit pricing power
Mitigant: Strong hedging coverage for 2026 on core grain inputs; management has embedded oil cost assumptions into full-year guidance.
Summary Risk Matrix
|
Company |
Primary Commodity Exposure |
Hedging Coverage |
2Q26 Guidance |
EBITDA Margin (1Q26) |
Adj. Net Leverage |
Overall Risk |
|
B&G Foods |
Soybean oil (+50% YoY) |
Partial |
No pricing action taken |
14.1% |
7.2x |
🔴 Highest |
|
Dole Plc |
Fertilizer, fuel, shipping |
Structural lag |
Explicit Q2 weakness guided |
4.3% |
1.7x |
🔴 High |
|
General Mills |
Wheat, corn, grains |
Lower |
Q2 profit decline guided |
15.0% |
3.3x |
🟠 High |
|
Nomad Foods |
Fish, fertilizer, fuel |
Good 2026 coverage |
Q2 headwinds flagged |
12.9% |
4.1x |
🟠 Meaningful |
|
Ingredion |
Corn (primary input) |
Hedged, co-products |
Q2 OI down high single digits |
14.4% |
0.8x |
🟠 Meaningful |
|
Kraft Heinz |
Coffee, meat, energy, resins |
Hedged to mid-Q3 |
Top line -3% to -5% Q2 |
23.2% |
3.2x |
🟡 Moderate |
|
Flowers Foods |
Wheat (hedged), oil derivatives |
Fully hedged on wheat |
H2 oil cost headwind |
10.1% |
3.2x |
🟡 Moderate |
Key Themes Across the Sector
- Hedging is the primary differentiator: Companies with strong forward hedging programs (Flowers Foods on wheat, Utz on fuel/ags/freight, Hersheys on cocoa) are largely insulated in 2026 but face a 2027 cliff risk if fertilizer-driven commodity prices remain elevated.
- Oil/energy is the surprise vector: Even companies hedged on agricultural commodities are being hit by oil-derived cost inflation (packaging resins, diesel, transportation) — a secondary transmission channel from the Middle East conflict that was not in original 2026 guidance for most companies.
- Consumer affordability constrains pricing power: Across the board, management teams are reluctant to take aggressive pricing action given consumer financial stress. This means cost inflation is more likely to compress margins than be passed through in 2Q26.
- The 2027 risk is underappreciated: The fertilizer shock's impact on crop yields (via nutrient under-application in Brazil, Africa, Southeast Asia) is a medium-term risk that will not fully manifest in 2Q26 results but should be on analysts' radar for 2H26 and FY27 guidance cycles.
- Midstream processors (ADM, Bunge, Ingredion) are the canary: Weakness in sweeteners/starches volumes at ADM and Ingredion signals that food manufacturers are already pulling back on forward purchasing — a leading indicator of demand softness that will flow through to branded food companies in subsequent quarters.
Disclaimer: This analysis was produced by Cognitive Credit AI and is based on management commentary from 1Q26 earnings calls and Cognitive Credit's curated financial data. Forward-looking statements reflect management views as of the call dates and are subject to change. This is not investment advice. General Mills' latest reported period is 3Q26 (fiscal year-end May), so its leverage and EBITDA data reflects a more recent period than the other companies shown.
Want to try Cognitive Credit AI? Request your demo today.
You might also like
 8 min read
 4 min read