Written by

Cross-market analysis is a vital component of credit research, allowing analysts to make direct comparisons between companies, markets and sectors to find relative value.
However, this process is often a challenge for analysts because:
- They do not always have access to detailed financial models from every issuer in their market/sector
- Amalgamating all that data in an easily digestible format across key credit metrics is a very time-consuming task
Every analyst knows the pain of manually updating a ‘Comps sheet’, pulling the latest financial information from disparate models across multiple locations. Fortunately, we’ve solved this challenge by aggregating all the data we process for every issuer in our universe and delivering it in one centralized view.
In this three-part series, we’ll cover everything you need to know about one of our most popular features: Comparables.
What is the Comparables feature?
Comparables offers a top-down view of all the key credit data we process. It’s built specifically to help credit analysts gain quick and differentiated insights into potential opportunities and determine relative value across companies, sectors and markets.
It’s made possible by our proprietary technology, which extracts financial data quickly and accurately. Built on native spreadsheet functionality, you can search, filter and evaluate our entire universe in just a few clicks.
The Comparables feature offers 3 different views of our data:
- Company view provides approximately 100 essential as-reported values and derived credit metrics for every issuer we cover, facilitating an efficient top-down fundamental view of the market in one convenient screen.
- Sector view provides sector-level aggregates of the Company Comparables data across 4 different levels of GICS aggregation.
- Market view presents an aggregated view of all tradable debt instruments across our coverage universes, supplemented with a broad set of pricing and reference data as provided by our market data partner S&P Global.
In this piece, we’ll focus on the Company Comparables view.
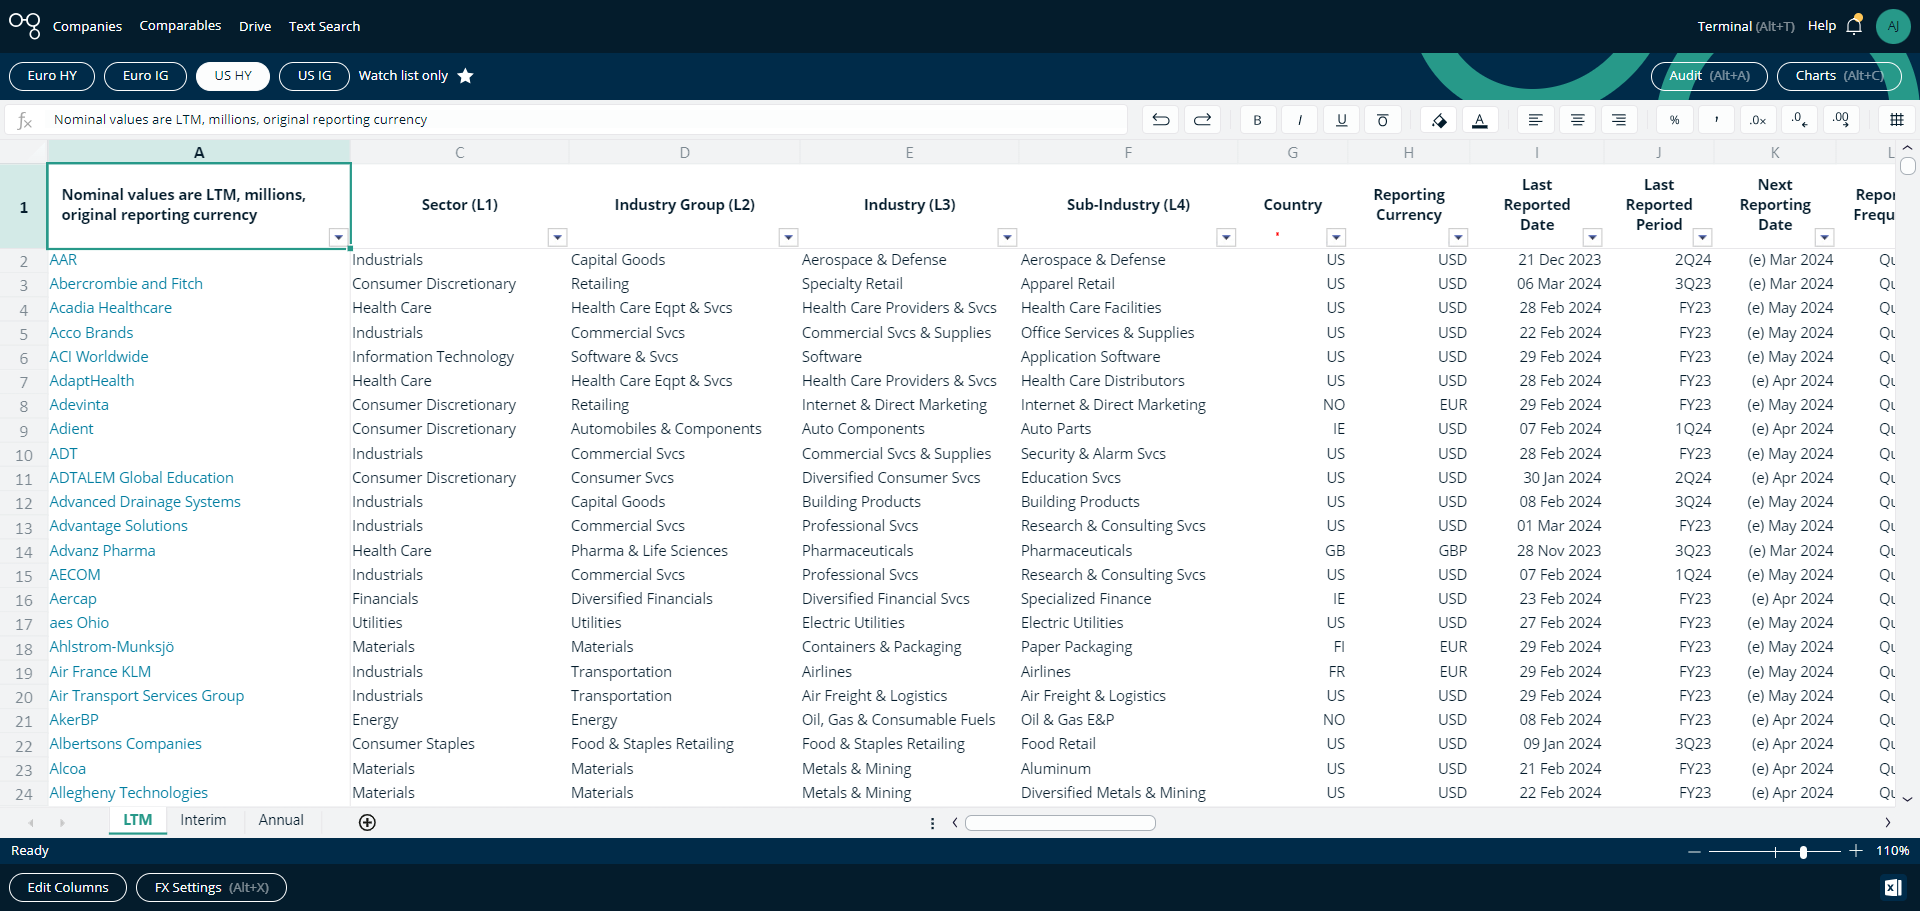
Introducing: Company Comparables
Our Company Comparables view aggregates over 100 reporting items and metrics for all companies in our coverage in one screen - allowing you to make convenient like-for-like comparisons between issuers.
Built on the same spreadsheet functionality as our credit models, it’s fully filterable to help you interrogate the data, and includes our dynamic auditing and charting functionality as standard. As with all our data, the Company Page is updated in real-time as new earnings data is published.
The short walkthrough below illustrates how quickly you can surface new insights using this feature.
Available with all subscriptions
Our Comparables feature is available as standard with a subscription to any of our data licenses, ensuring your cross-market analysis is convenient and comprehensive. In our next piece, we’ll cover the Sector Comparables view.
If you’d like to try our Comparables feature out for yourself, request your demo today.
You might also like
 12 min read
 1 min read
