Written by

In the second of our cross-market analytics series, we show how our Sector Comparables feature makes sectoral comparisons much more convenient.
Cross-market analysis is a vital component of credit research, but it’s a challenging and time-consuming process. Every analyst knows the pain of manually updating a ‘Comps sheet’, pulling the latest financial information from disparate models across multiple locations.
Fortunately, we’ve solved this challenge by aggregating all the data we process for every issuer in our universe and delivering it in one centralized view in our Comparables feature.
In the first of our cross-market analytics series, we focused on how our Company Comparables view enables easy company-to-company analysis.
In this second piece, we focus on our Sector Comparables.
What is the Comparables feature?
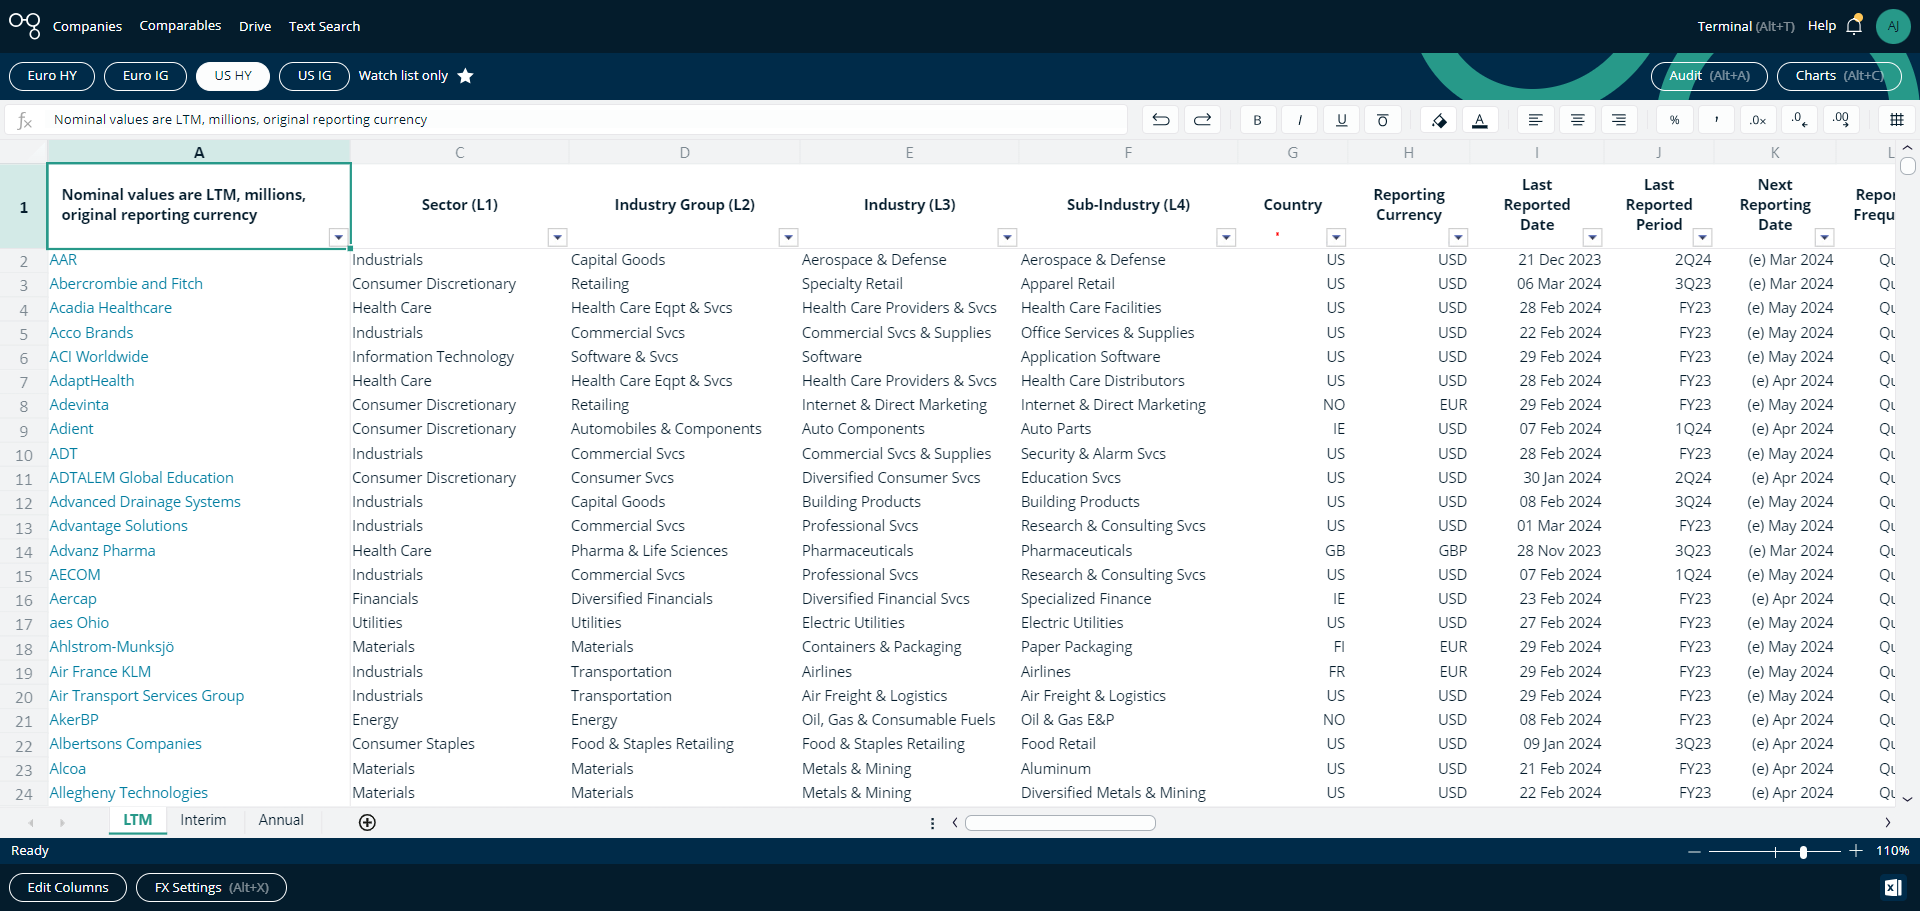
The Comparables feature offers a top-down view of all the key credit data we process. It’s built specifically to help credit analysts gain quick and differentiated insights into potential opportunities and determine relative value across companies, sectors and markets.
It’s made possible by our proprietary technology, which extracts financial data quickly and accurately. Built on native spreadsheet functionality, you can search, filter and evaluate our entire universe in just a few clicks.
The Comparables feature offers 3 different views of our data: Company, Sector and Market.
Introducing: Sector Comparables
Our Sector Comparables view is the most efficient way of viewing each data license on a top-down basis. It aggregates fundamental data from every company in our coverage universe via Global Industry Classification Standard (GICS).
It includes familiar features from our other Comparables views such as detailed auditing, dynamic charting, FX normalization (EUR, GBP or USD) and the ability to tailor your view with up to 100 aggregated credit metrics.
Sector Comparables also includes a unique option to include or exclude Outliers from your view (as defined as 1.5x the interquartile range of any selected data). And, unlike Company Comparables, this view includes data from credits you don’t have access to - ensuring Sector data is always comprehensive.
The short walkthrough below illustrates how to quickly surface sector-level insights using this view.
Available with all subscriptions
Our Comparables feature is available as standard with a subscription to any of our data licenses, ensuring your cross-market analysis is convenient and comprehensive. In our third and final piece, we’ll cover the Market Comparables view.
If you’d like to try our Comparables feature out for yourself, request your demo today.
You might also like
 2 min read
 5 min read
