
Welcome to our first Sector In Focus!
Each quarter, we'll select a specific sector from our coverage and dive into the numbers to demonstrate how Cognitive Credit can be used to inform high-level analysis of a sector, quickly and easily. In our inaugural edition, we’re focusing on the Real Estate sector.
Why Real Estate?
Leveraged Real Estate businesses face a challenging few years, with significant volumes of comparatively cheap debt coming due in 2025 and 2026. An increased cost of financing, both at the corporate and asset-backed level, will hamper debt-servicing metrics and cash flows. Meanwhile, higher capitalization rates are impacting property valuations.
Credit investors must ensure an understanding of which issuers are best positioned to navigate this tricky period.
Under the MSCI/S&P GICS (Global Industry Classification Standard), the Real Estate sector is split into two subsectors:
-
Equity Real Estate which encompasses REITs (Real Estate Investment Trusts). These companies are exempt from corporation tax on rental income and gains on sales of investment properties. Instead, tax is levied at the investor level, and hence a key criteria for REIT status is the distribution of at least 90% of profits each period.
-
Real Estate Management & Development companies which operate across equivalent asset classes, but are not subject to the same tax structure and associated requirements.
FFO vs Net Debt - US HY
FFO (Funds From Operations) is widely used across the Real Estate industry as a measure of operating performance. Cognitive Credit defines FFO as Cash Flow from Operating Activities, adjusted for movements in working capital, and less interest paid. A higher FFO suggests a stronger ability to generate cash to service debt, which given the current interest rate environment and upcoming maturity wall, will be under scrutiny by investors.
Using our Comparables feature, we can quickly visualize FFO vs Net Debt across the industry and identify issuers of potential interest. We have charted all L3 Real Estate issuers on the US High Yield license.
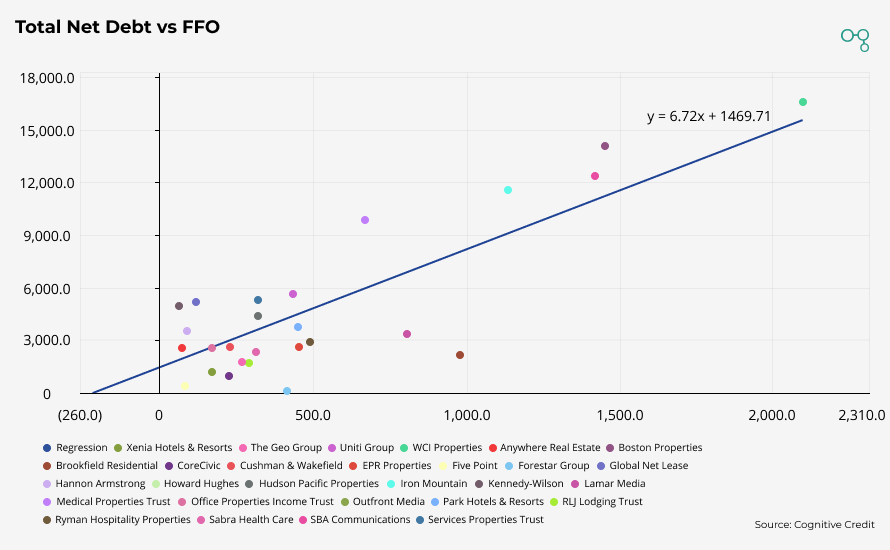
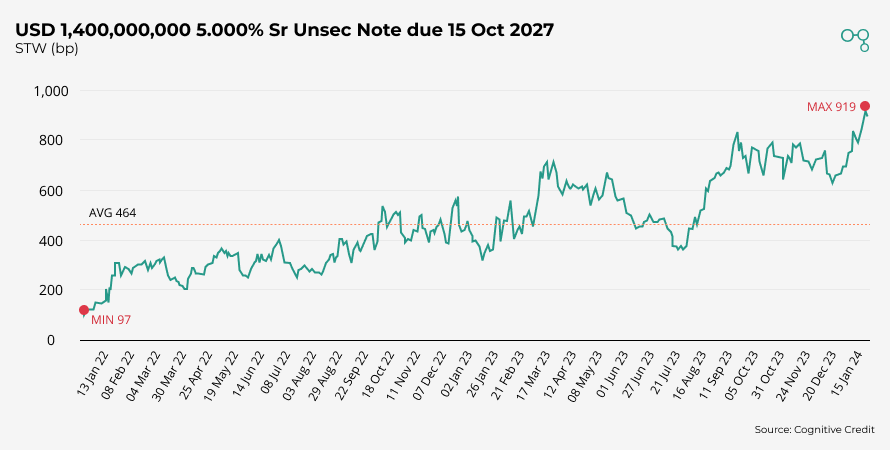
Medical Properties Trust has a low LTM FFO ($669m) to Net Debt ($9,864m) at (6.8%). They have a flat yield curve, with their Sr Unsec notes yielding 11.5-13.5%. The spread on their USD 5% Senior Unsecured Notes due 2027 has approximately doubled over the last twelve months and is currently close to 900 bp and is now trading at a cash price in the 70s.
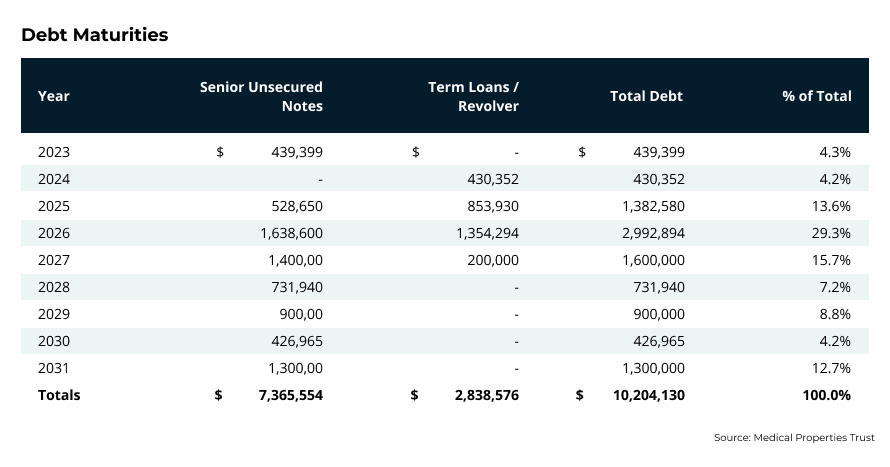
Investors are likely concerned by Medical Properties’ front-loaded maturity profile with 67% of their current outstanding debt coming due by the end of 2027. Most of this will likely require refinancing at much higher rates, increasingly squeezing their already struggling FFO.
Brookfield Residential has a strong LTM FFO ($978m) vs Net Debt ($2,172m) of 45.0%. Clicking through to the underlying Cognitive Credit Financial model reveals their LTM FFO is inflated by a 4Q22 $812m sale of Commercial Properties, which once removed results in an LTM FFO of $166m, and a position much closer to the regression line.
Lamar Media also has a strong LTM FFO ($805m) to net debt ($3,362m) ratio of 24.0%. Interestingly, they operate in a non-traditional asset class, renting out space for advertising on billboards, buses, shelters. We will consider traditional vs emerging asset classes later in this post.
FFO vs Net Debt - Euro HY
Again, using the comparables feature, we have charted all L3 Real Estate issuers on the Euro High Yield license, this time plotting FFO as a percentage of Net Debt.
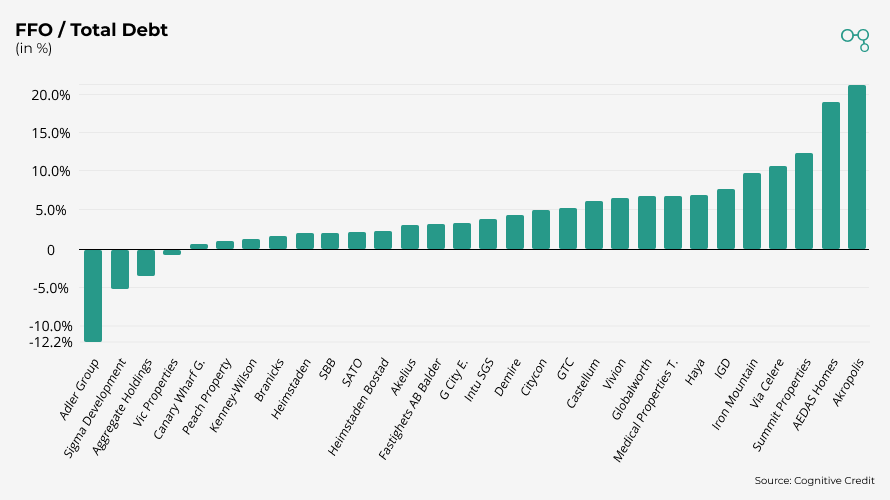
Adler Group has a negative LTM FFO (-$751m) to Net Debt ($6,245m) of -12.0%, which is not unexpected given the fraud allegations and subsequent contentious restructuring. Also with negative LTM FFO, Signa Development has filed for insolvency and last year Vic Properties announced new ownership and financial structure in a separation from Aggregate Holdings as they themselves restructure.
Heimstaden Bostad has a low LTM FFO ($400m) as a percentage of Net Debt ($17,605m) at 2.3%. Management reported a persistent positive trend in net operating margin in their 3Q23 report.
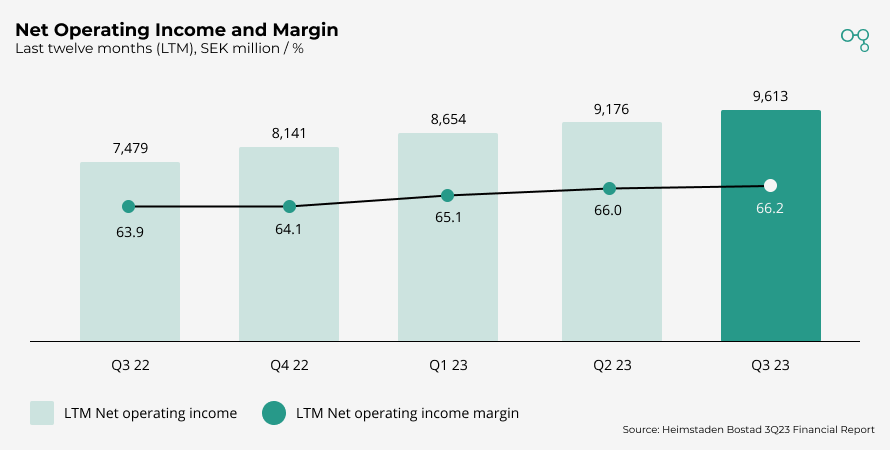
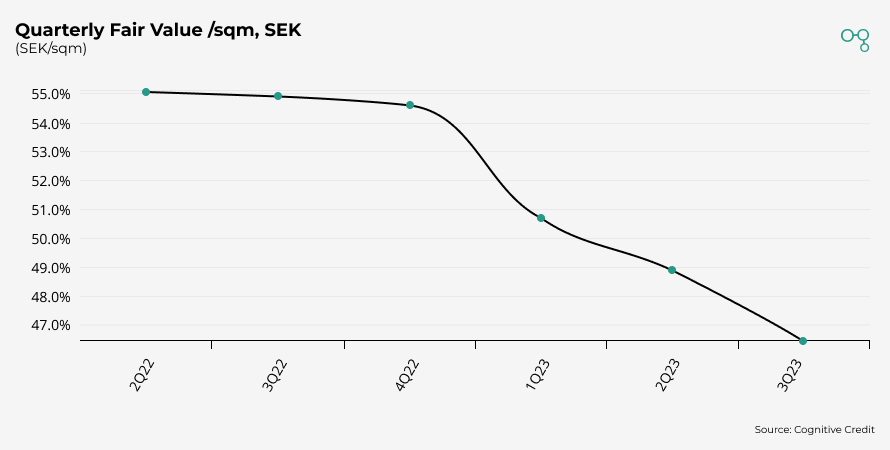
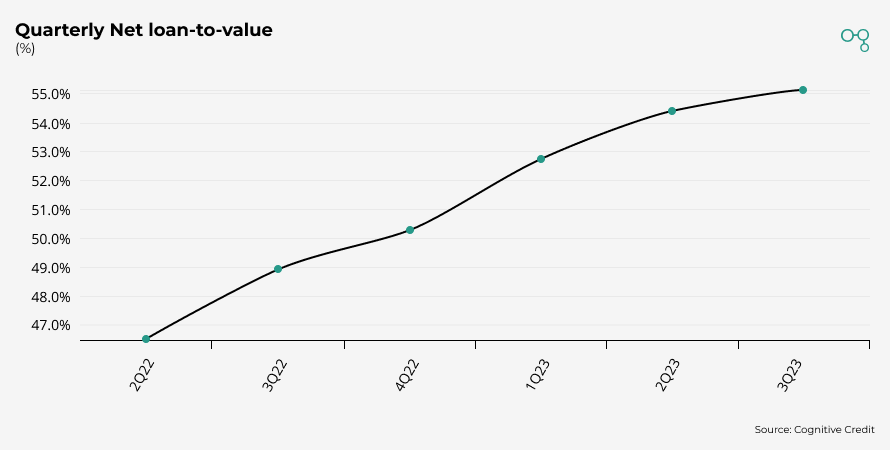
However, Heimstaden Bostad’s KPIs paint a different picture. Fair value/sqm has consistently declined over the last six quarters, and consequently LTV has increased. ICR (Interest Coverage Ratio) has approximately halved over the same period.
The decline in ICR has been primarily driven by an increase in cash interest payments. It was the decline in ICR which resulted in Fitch downgrading the Long-Term Issuer Default Rating of their parent company Heimstaden AB in September last year.
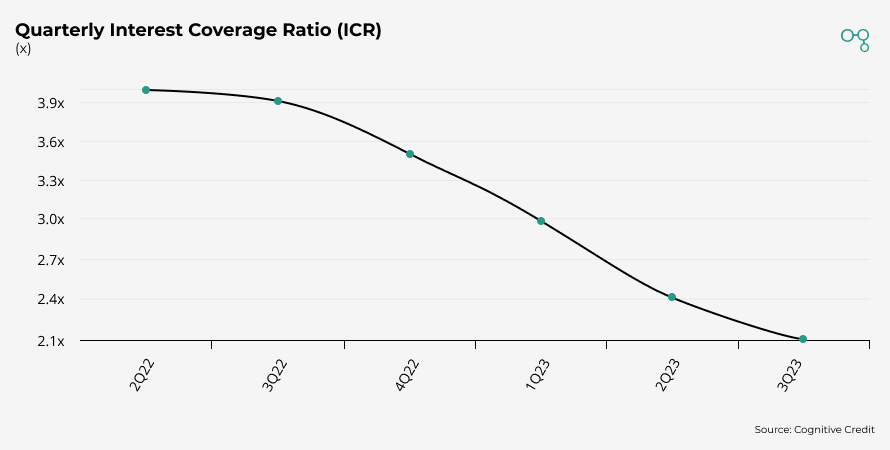
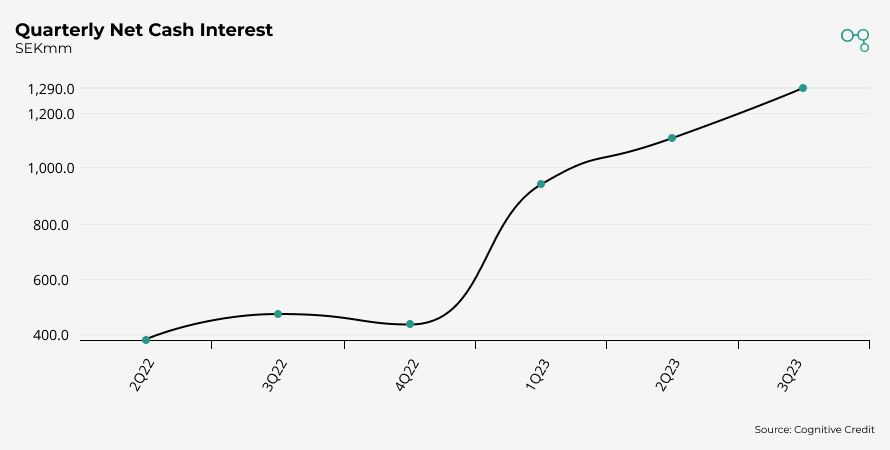
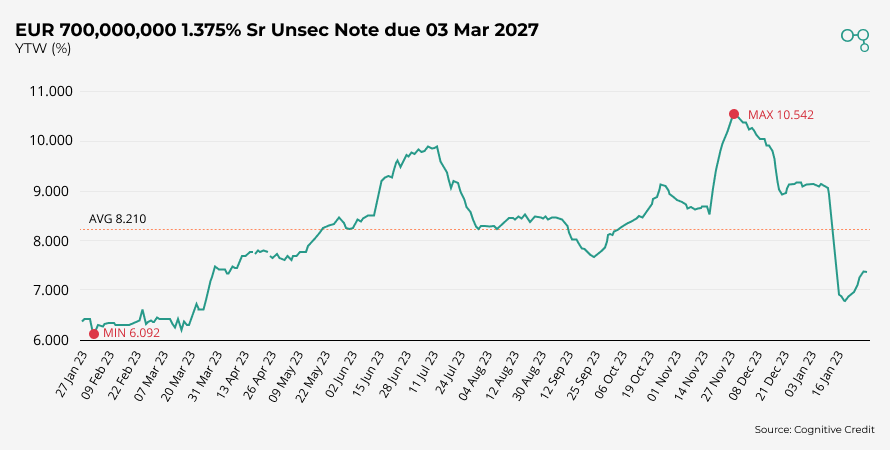
Heimstaden Bostad faces a large portion of their debt requiring refinancing in the next three years, and while yields have fallen from their peak, Heimstaden Bostad will be required to refinance upcoming debt maturities at significantly higher rates, further pressuring ICR.
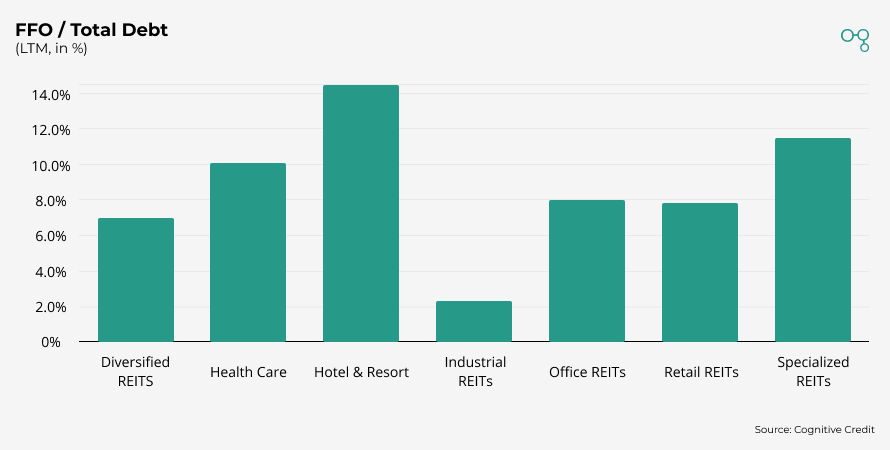
Iron Mountain has a strong LTM FFO ($1,134m) versus net debt ($11,571m) of 9.8%, although it should be noted their business is more diversified than Real Estate. 61% of their LTM revenue is from the rental of storage space, the remainder from various services including data management, digital solutions, entertainment services and secure shredding. As first mentioned in regards to Lamar Media, this is reflective of the general industry trend in moving away from traditional asset classes (residential, office, retail, industrial) - to emerging sectors such as; data centers and self storage. Interestingly, it is indeed those traditional asset classes which have the lowest LTM FFO as a percentage of Net Debt. The Hotels and Resorts Sub-Industry appear to be justifying their, lower, 6% yields.
Sector analysis has never been more convenient
Real Estate is a challenging industry to analyze, but given its size and sensitivity to interest rate changes, it is a sector you cannot afford to ignore.
Cross-market analysis like the above is easy with Cognitive Credit. Our Comparables feature offers a top-down view of all our fundamental data across our four coverage universes (European & US High Yield, and European & US Investment Grade), allowing you to find relative value opportunities across your markets, sectors and companies quickly and conveniently.
To see our Comparables feature in action, request your demo today.
You might also like
 2 min read
 5 min read
