
Our analysts take a look at the data from the FY24 earnings cycle and identify more interesting observations across US markets and sectors.
After each earnings cycle, we take some time to analyze the enormous amount of data we process with our Comparables feature - a powerful tool to view markets and sectors top down and in their entirety - to see what sector trends jump out at us across our current coverage universes.
Each quarter, we publish some of those insights in this blog as a representation of the depth of information available in our datasets, and the ease with which it can be analyzed from a top-down vantage.
Without further delay, here's our Quarterly Earnings Breakdown for FY24 - US Edition.
Energy: Uptick in drilling activity
In the first quarter, the energy sector led the pack with the strongest top-line growth in both US High Yield (HY) and Investment Grade (IG), driven by elevated production volumes. Average revenue was up 14% year-over-year (YoY).
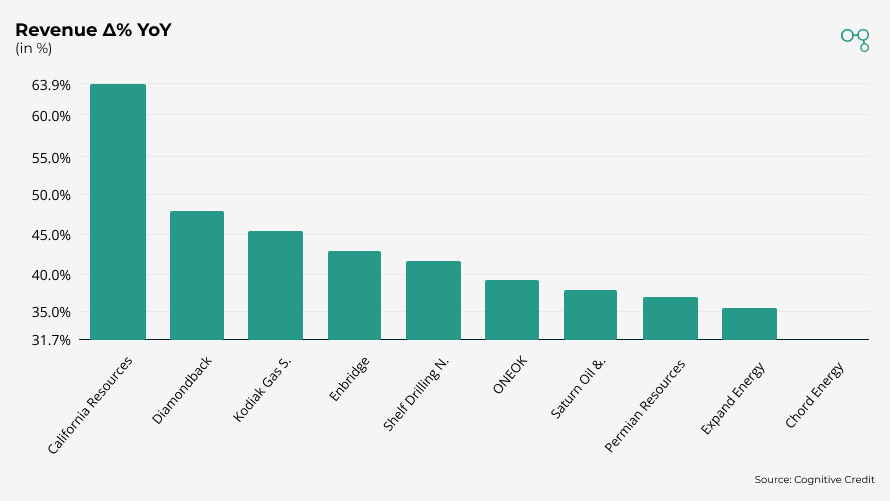
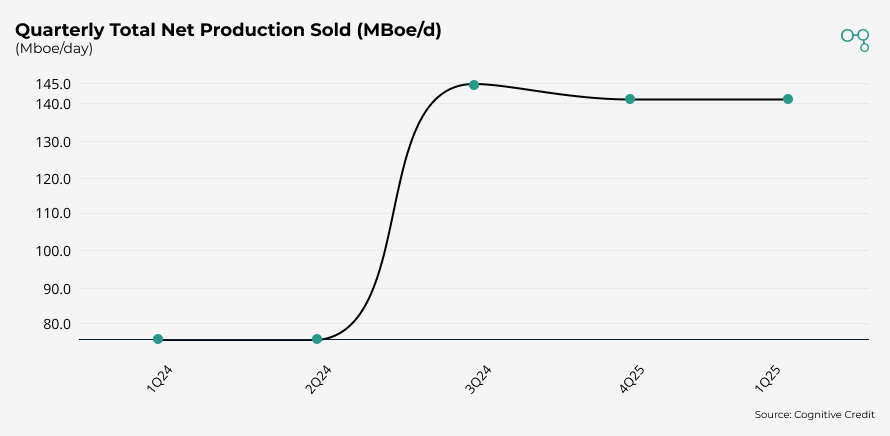
California Resources’ revenue growth of ~64% in 1Q25 was underpinned by increased production. Average oil volume of ~141 MBoe/d compared to ~76 MBoe/d in the prior year, owing to the acquisition of Aera Energy.
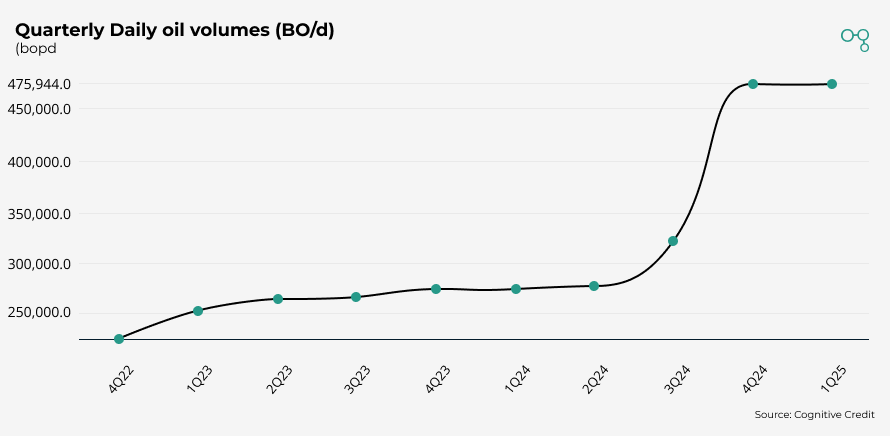
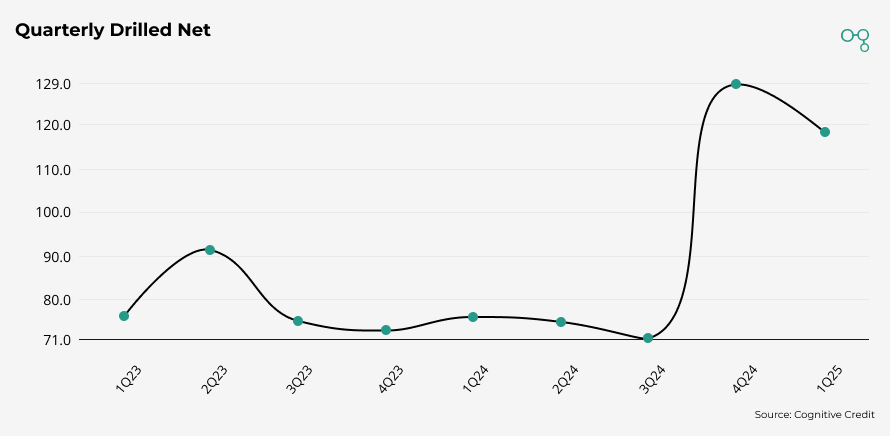
At Diamondback Energy, reported revenue grew by 48%, supported by elevated volumes with average oil production of 475.9 MBO/d, compared to 273.3 MBO/d in the prior year. This is primarily attributed to the significant increase in the number of net wells drilled, growing from 76 in 1Q24 to 118 in 1Q25.
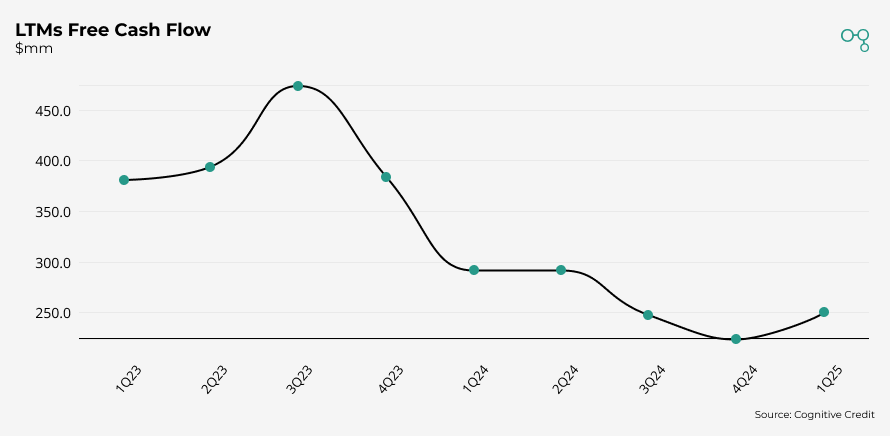
IG Consumer Durables & Apparel facing continued headwinds
Consumer durables continued to struggle given headwinds such as inflation concerns, tariffs, and elevated borrowing costs. In the latest quarter, average YoY revenue was down 4.5% for the sector as a whole. The Household Durables sub-industry was especially weak, with revenue declining 7.5% YoY.
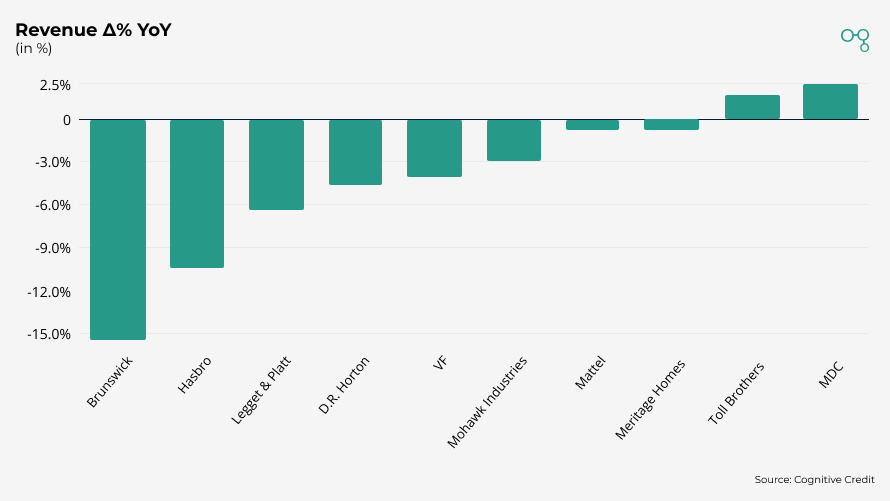
Leggett & Platt, a home furnishing company, saw its revenue fall by over 6% year over year. The decline was driven by a volume decrease in its core bedding and specialty foam segments, in addition to the loss of some key customers.
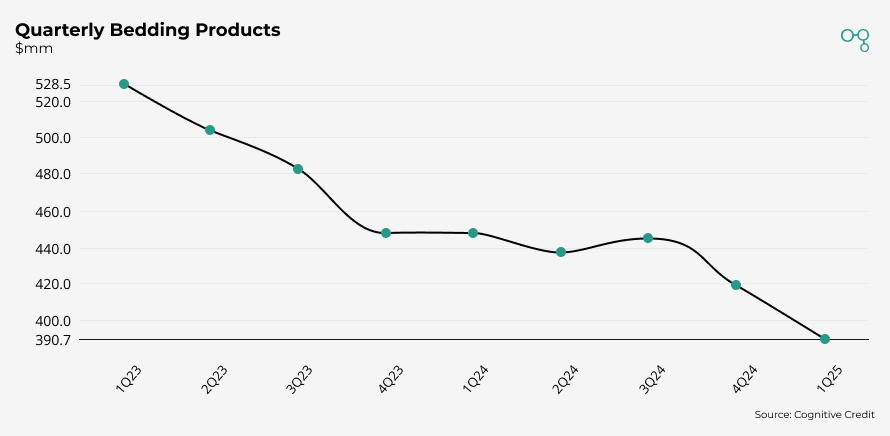
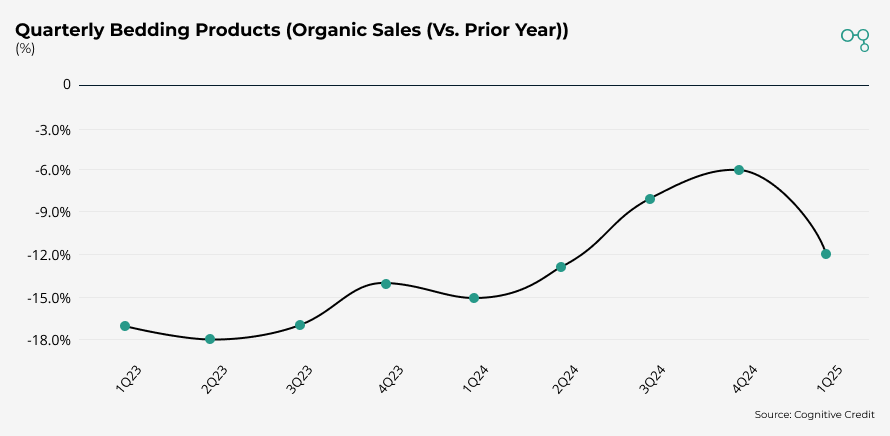
Given Leggett & Platt’s relatively high fixed cost base, this had an outsized impact on profitability, which has continued to put pressure on the Company’s LTM EBITDA margins and Free Cash Flow.
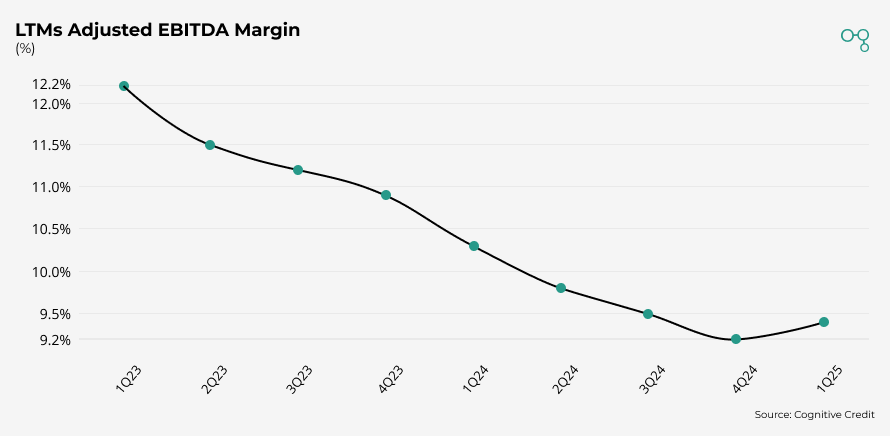
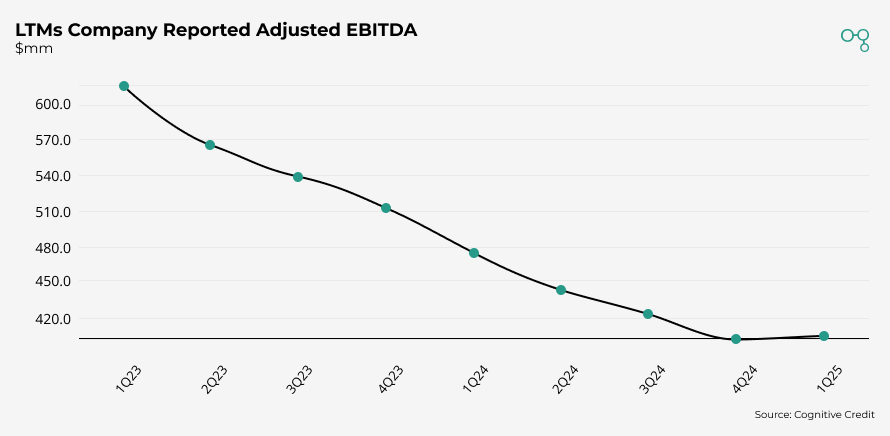
Despite these operational headwinds driving leverage from 2.9x to 3.8x over the past two years, bond spreads normalized post-April tariff volatility. Credit spreads currently trade at a modest 148bp vs an average of 180 over the past year and a peak of 244 in April, indicating potential richness.
Technology Hardware & Equipment: Western Digital shines
The technology sector continues to grow with an average year-on-year revenue increase of 6%, led by outsized gains in the storage and infrastructure segments.
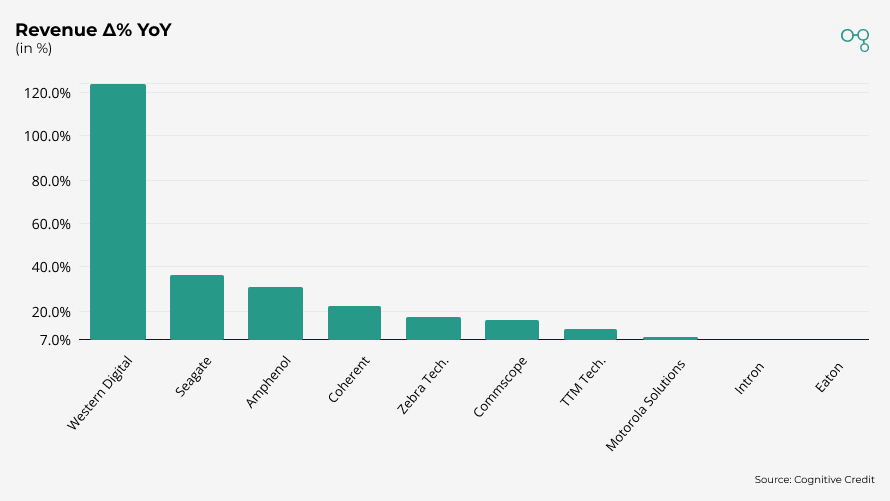
Western Digital’s LTM revenue soared by ~123%, attributed to a surge in cloud datacenter demand. LTM revenue from the Cloud segment has increased from ~$4.3b to ~$8.1b YoY.
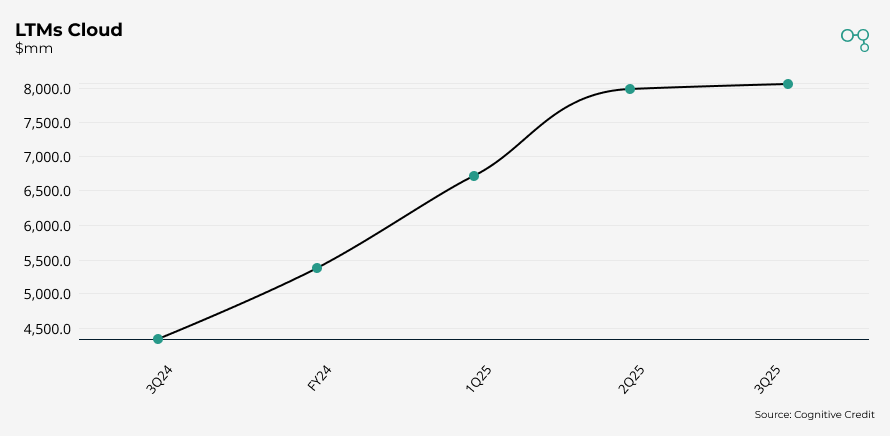
Western Digital’s gross margin has surged by an impressive ~10.0%, showcasing the pricing power of the business. Average sales price has grown from $145 to $179 over the past year.
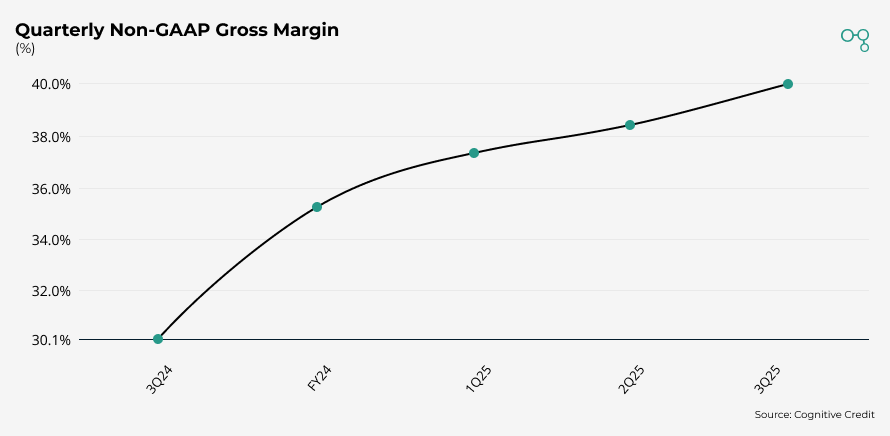
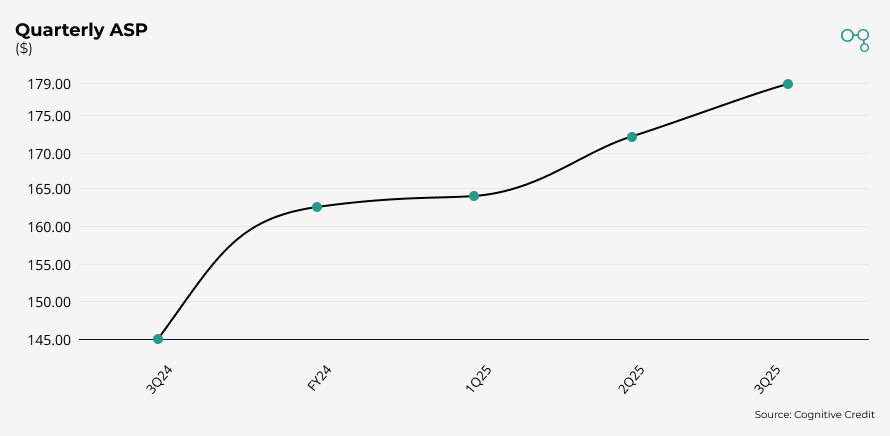
Western Digital’s bond spreads have narrowed by ~100bps YTD, reflecting strong investor sentiment.
Analyze the entire market, faster
Cross-market analysis like the above is easy with Cognitive Credit. Our Comparables feature offers a top-down view of
all our fundamental data across our four coverage universes (European & US High Yield, and European & US Investment Grade), allowing you to find relative value opportunities across your markets, sectors and companies quickly and conveniently.
To see how our cross-market data and analytics could help your business, request your demo today.

You might also like
 12 min read
 1 min read
