Our analysts take a look at the data from the 3Q24 earnings cycle and identify more interesting observations across US markets and sectors.
After each earnings cycle, we take some time to analyze the enormous amount of data we process with our Comparables feature - a powerful tool to view markets and sectors top down and in their entirety - to see what sector trends jump out at us across our current coverage universes.
Each quarter, we publish some of those insights in this blog as a representation of the depth of information available in our datasets, and the ease with which it can be analyzed from a top-down vantage.
Without further delay, here's our Quarterly Earnings Breakdown for 3Q24 - US Edition.
Media & Entertainment regime shift outlasts Covid-19
In Media & Entertainment, we observed the continuation of a steady trend away from traditional cable & broadband services and towards streaming.
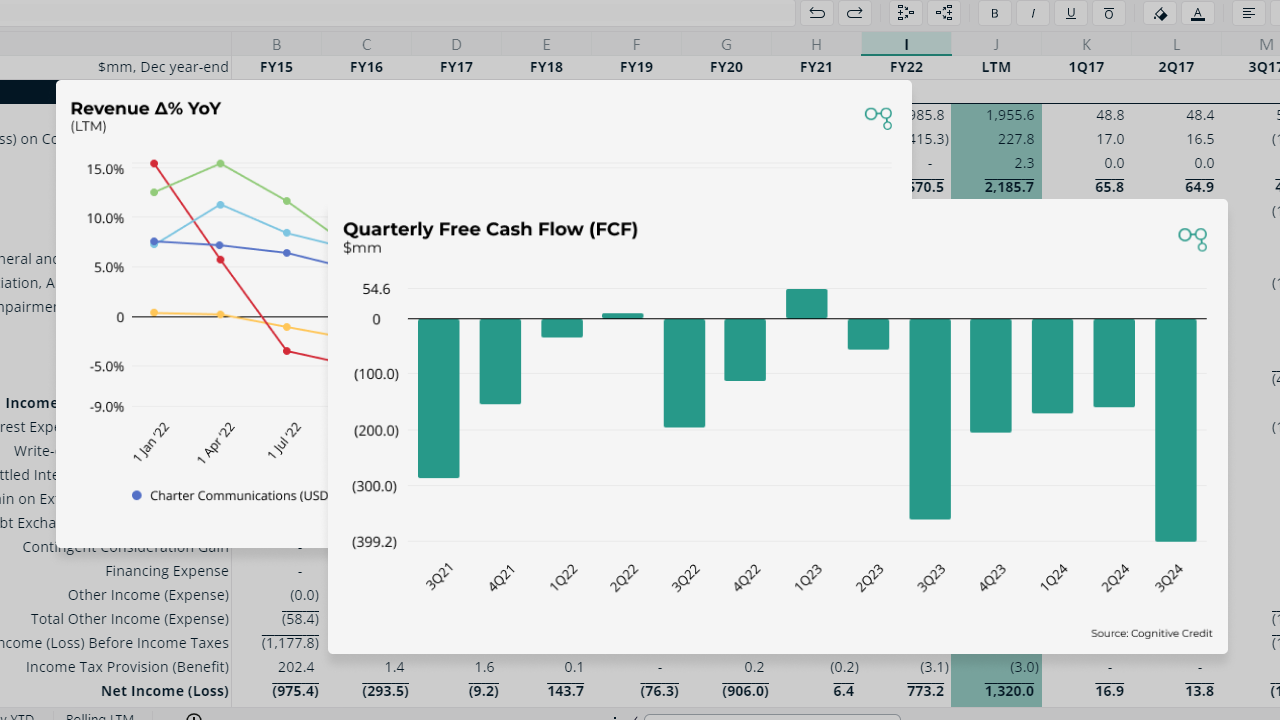
Collectively, major legacy media companies including Comcast, Charter Communications, Dish Network, Fox, and Dish DBS saw LTM revenue down 3.5% YoY. The rate of decline has been picking up for Dish DBS in recent quarters.

In contrast, the companies controlling the largest US streaming services have seen LTM revenue grow by 6.9% year over year, collectively. These include Netflix, Alphabet (Youtube TV), Disney (Hulu TV, Disney+), and Paramount Global (Paramount+).

A pure-play on streaming, Netflix may offer the most direct insight. LTM revenue growth remains healthily positive at 14.8%, and has actually re-accelerated since July 2023, indicating a trend that has outlasted any shorter term covid effects.
We observe an impressive climb in its Quarterly Paid Memberships KPI since the start of 2020, with the rate of subscriber growth in the last 2 years (12.3%) actually outpacing the overall rate of growth since covid (10.2%).

This is in stark contrast to DISH DBS, a prominent example of legacy satellite media, where we observe a marked decline in quarterly Pay TV and Dish TV subscribers. This declining viewership has persisted steadily since the start of covid and through the post-covid regime to date.


While the top line is slightly declining at Paramount Global, this company is not a pure play on streaming at the corporate level. However, looking deeper into its KPIs to interpret the adoption of its Paramount+ Streaming service, we can see that the quarterly subscriber base has grown by a stunning 62.5% CAGR since its 2020 inception.

These data points appear to present a durable secular shift away from legacy media and towards streaming.
Airlines stable, with a low-flying exception
Interim revenues in US airlines broadly were close to flat year over year at +1.7%. Consumer travel spending appeared to stabilize after Covid related volatility in years prior. Despite the mostly flat overall picture, we did observe winners and losers within the space.

Alaska Air Group, up 8.2%, looks to have gained market share in the latest period. The airline is the 6th largest in the United States and is known for competing on its “unique spirit” and service professionalism. Alaska’s growth led the sector, driven by an impressive rebound in its quarterly revenue passengers KPI.

Spirit Airlines, the largest budget carrier in the U.S., was a loser in the sector with revenues down 6.5%. It made a noteworthy Chapter 11 bankruptcy filing in November 2024. This follows years of operating losses, failed mergers and other challenges, contributing to approximately $2.1 billion of negative free cash flow over the last 3 years.

Indicative of its profitability challenges, the company’s revenue per available seat mile grew at just over 3% annually over the last 3 years; this lagged far behind the pace of expense growth. In the same time period, average fuel costs grew at over 10% annually and labor costs grew at 15.5% annually


Spirit Airlines’s SAVE 8.00% Secured Notes due Sep 25 hit a low of almost $40 before jumping substantially on news of restructuring plans which would hand control of the company to its bondholders. The Notes currently trade around $80.

Residential Building & Construction takes a pause
Looking at the top 10 companies by revenue in HY Building Products, Construction & Engineering, it appeared to be a flat and uneventful quarter overall. However, crosscurrents were present beneath the surface in this sector as well.

Dycom stood out with the highest interim period growth at 12.0%. This company focuses on specialty contracting services to the telecom infrastructure niche, and benefitted from a large increase in quarterly spending by AT&T, its largest customer.

Excluding Dycom, Building & Construction companies shrunk in the quarter. Offering a snapshot into the residential construction market, Builders Firstsource, a leading supplier of materials to homebuilders and sub-contractors, contracted by 6.7%. Jeld-Wen, one of the world’s largest door and window manufacturers, saw revenues decline by some 13.2% and took a $63 million goodwill impairment charge.
The decline was driven by a marked decline in volumes across the company’s North America and Europe segments. While the rate of decline in Europe has moderated somewhat off the lows, volume trends remain solidly negative in both regions.


Could these symptoms of more cautious global construction activity persist into the new Presidential regime? Stay tuned to Cognitive Credit KPI data to keep tabs on the upcoming trends.
Analyze the entire market, faster
Cross-market analysis like the above is easy with Cognitive Credit. Our Comparables feature offers a top-down view of all our fundamental data across our four coverage universes (European & US High Yield, and European & US Investment Grade), allowing you to find relative value opportunities across your markets, sectors and companies quickly and conveniently.
To see how our cross-market data and analytics could help your business, request your demo today.

