Our analysts take a look at the data from the 2Q24 earnings cycle and identify more interesting observations across European markets and sectors.
As each quarterly earnings cycle ends, we take some time to analyze the enormous amount of data we process with our Comparables feature - a powerful tool to view markets and sectors top down and in their entirety - to see what sector trends jump out at us across our current coverage universes.
Each quarter, we publish some of those insights in this blog as a representation of the depth of information available in our datasets, and the ease with which it can be analyzed from a top-down vantage.
Without further delay, here's our Quarterly Earnings Breakdown for 2Q24 - European Edition.
Chlor-alkali producers the underperformers in Euro Chemicals sector
Broadly speaking the European chemicals sector had a good 2Q24 with the median EBITDA up +5%yoy, however there was a wide dispersion across our coverage universe.

Two out of the four worst performers in the European chemicals space are businesses that operate in the chlor-alkali value chain, manufacturing PVC and the byproduct of chlorine production, caustic soda. Whilst these products are often counter-cyclical to each other, weak levels of European demand, particularly in construction (PVC) and other industrial markets (caustic soda) have unusually caused weakness in the price of both products simultaneously.
Using the Cognitive Credit application, and data derived from Kem One’s disclosed segment revenue and volume KPIs we can calculate the following approximate price moves:


Self help steers Autopart profitability in a softer market
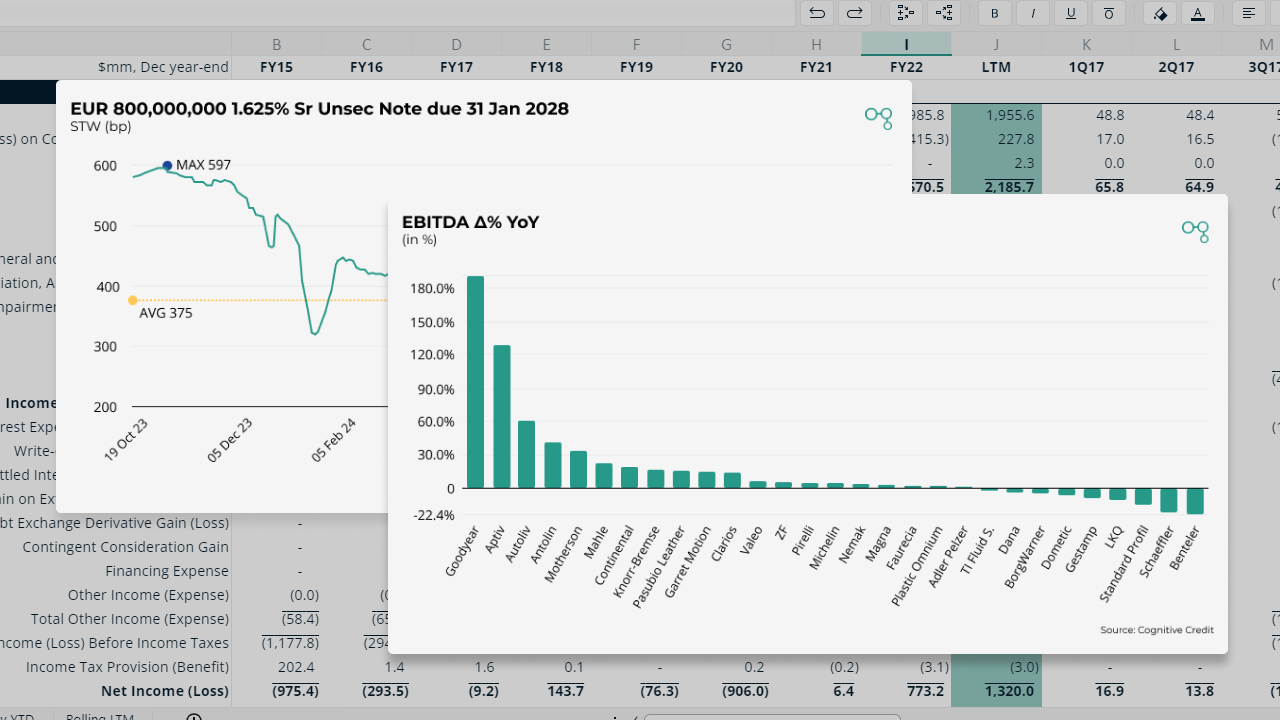
Most European Auto Components manufacturers suffered declining yoy revenue in 2Q24 as weak vehicle markets in Europe and N America impacted volumes. Despite this, roughly half our EUR HY & IG coverage universe managed to increase their EBITDA yoy.


Antolin demonstrated this in its 2Q24 results. Despite revenue falling 10% yoy, EBITDA rose 6% yoy thanks to efficiencies from its Transformation Plan including successful renegotiations with its supply chain as well as fixed costs reductions. EBITDA margins therefore rose +130bp yoy.

Have Commercial Property valuations troughed?
Rising required property rental yields continued to affect commercial property valuation in 1H24. For example Aroundtown’s 2Q results exhibited rental yields reaching a new high, and the associated effect on property values per sqm pushed the Company’s Loan-to-Value measures to new highs.


However, into the second half of the year, as the interest rate cycles in developed markets moved into a loosening environment, this could well be the trough in commercial property valuations. Aroundtown’s bondholders certainly appear to think so - spreads on its senior unsecured notes have been on a tightening path all year, indicating that investors are comfortable that portfolio valuations have broadly stabilized.

Laying the UK Gaming industry
The odds of gaming tax rises in the new UK Government’s first budget at the end of this month appear to have tightened, at least according to recent UK press articles. This caused a sell-off in UK gaming company bond and equity prices, such as evoke’s.

Unfortunately evoke plc enters this period of uncertainty after poor 1H 24 results after margins collapsed and FCF remains negative.


Flutter on the other hand maintained robust margins through the second quarter, demonstrating the benefits of its more internationally diversified business.

Entain (within our European Leveraged Loan coverage universe) has also seen a drop in margins, but not on the scale of evoke’s, and more importantly, is still generating FCF.


Analyze the entire market, faster
Cross-market analysis like the above is easy with Cognitive Credit. Our Comparables feature offers a top-down view of all our fundamental data across our four coverage universes (European & US High Yield, and European & US Investment Grade), allowing you to find relative value opportunities across your markets, sectors and companies quickly and conveniently.
To experience our web-app first-hand, sign up for complimentary access here.
