
With the second quarter’s earnings finishing, our analysts take a look at the data from the latest earnings cycle and identify more interesting observations across markets and sectors.
Throughout the earnings calendar, we process an enormous amount of data before publishing it to our application as ready-to-use credit models. As each quarterly cycle ends, we take some time to analyze the data in-application with our Comparables feature - a powerful tool to view markets and sectors top down and in their entirety - to see what sector trends jump out at us across our current coverage universe (European & US High Yield, as well as the BBB cohort of the European Investment Grade universe).
Each quarter, we'll publish some of those insights in this blog as a representation of the depth of information available in our datasets, and the ease with which it can be analyzed from a top-down vantage.
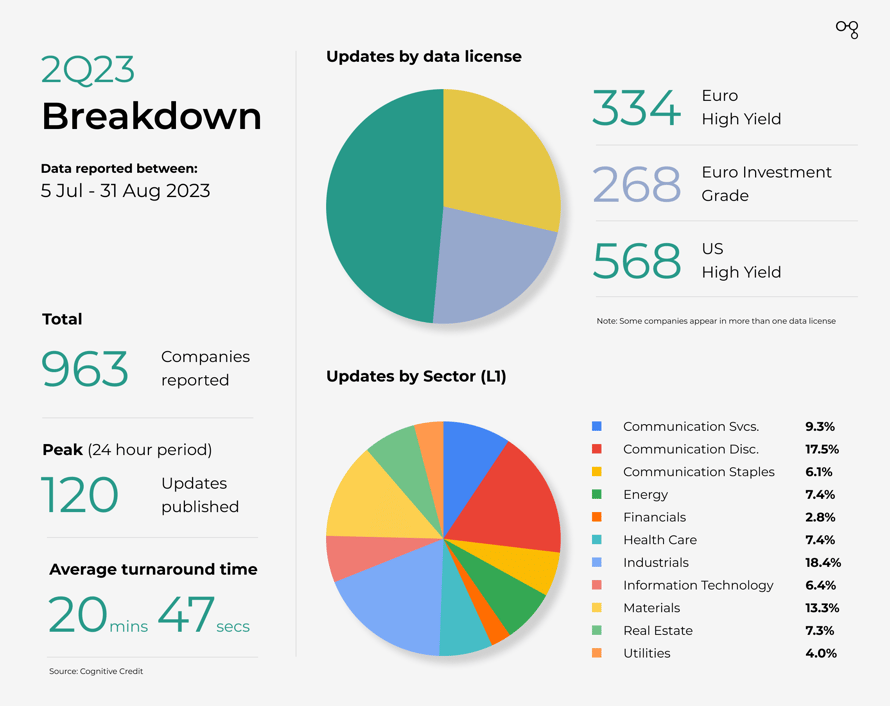
2Q23: By the numbers
Let’s start with a quick look at how much earnings data has been processed for 2Q23 to date:
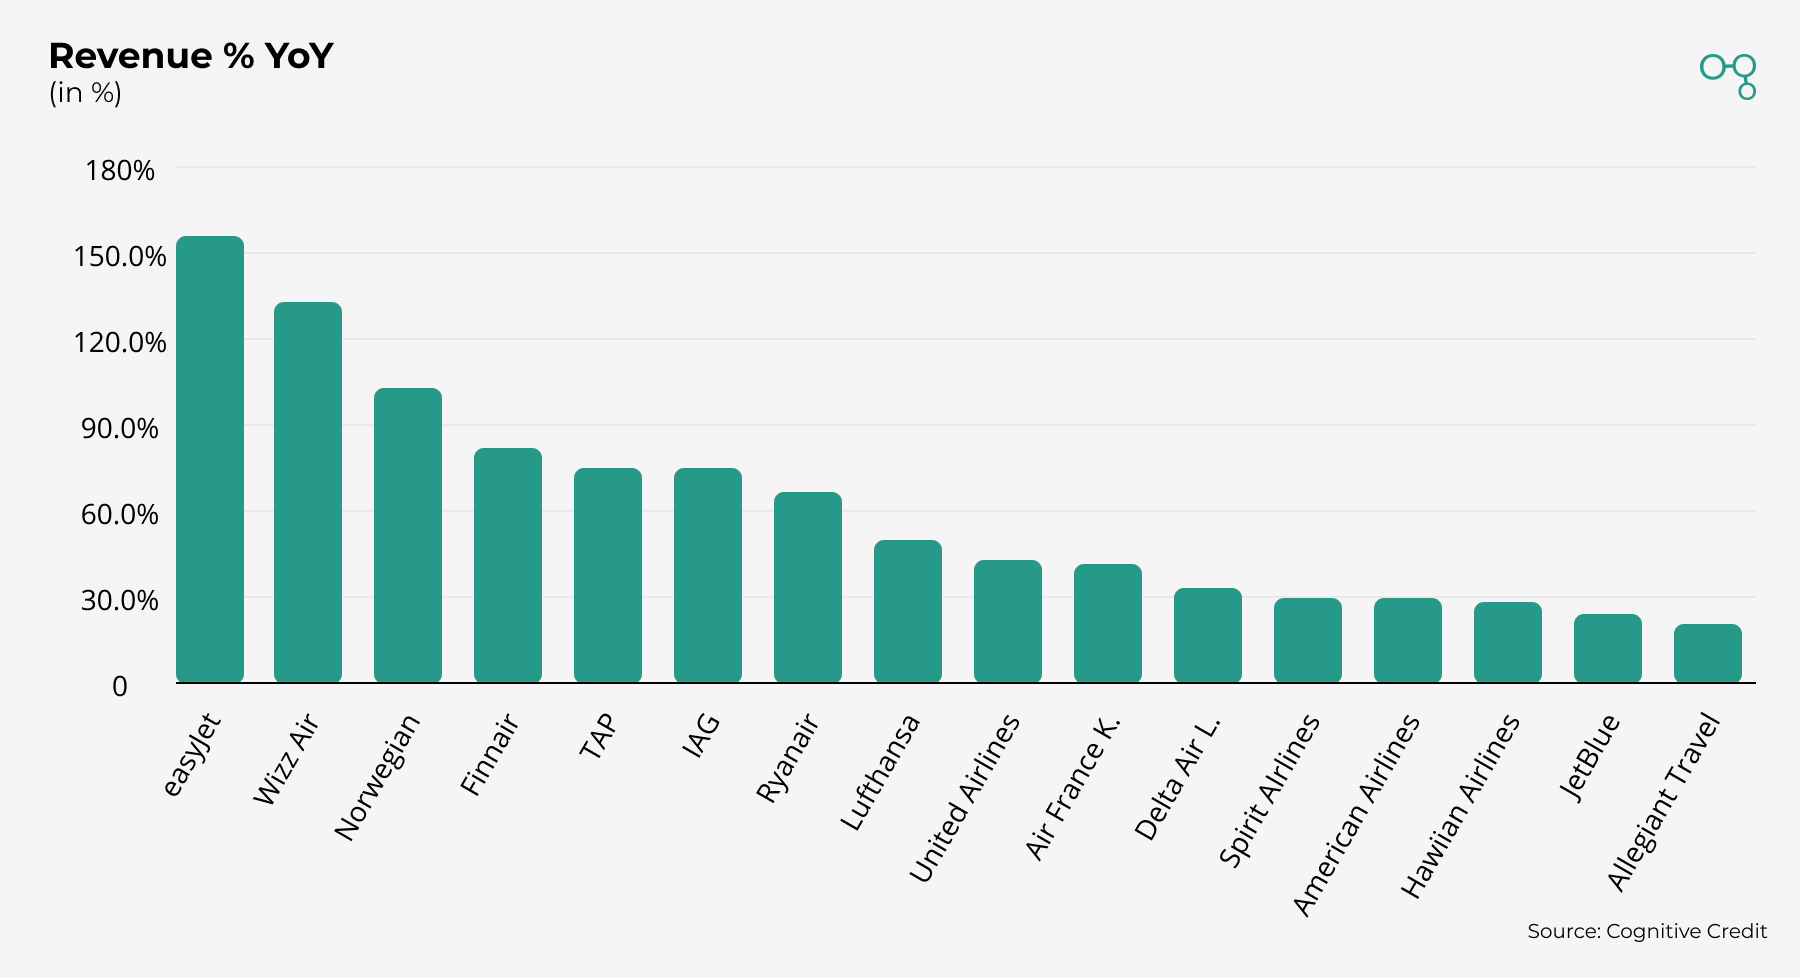
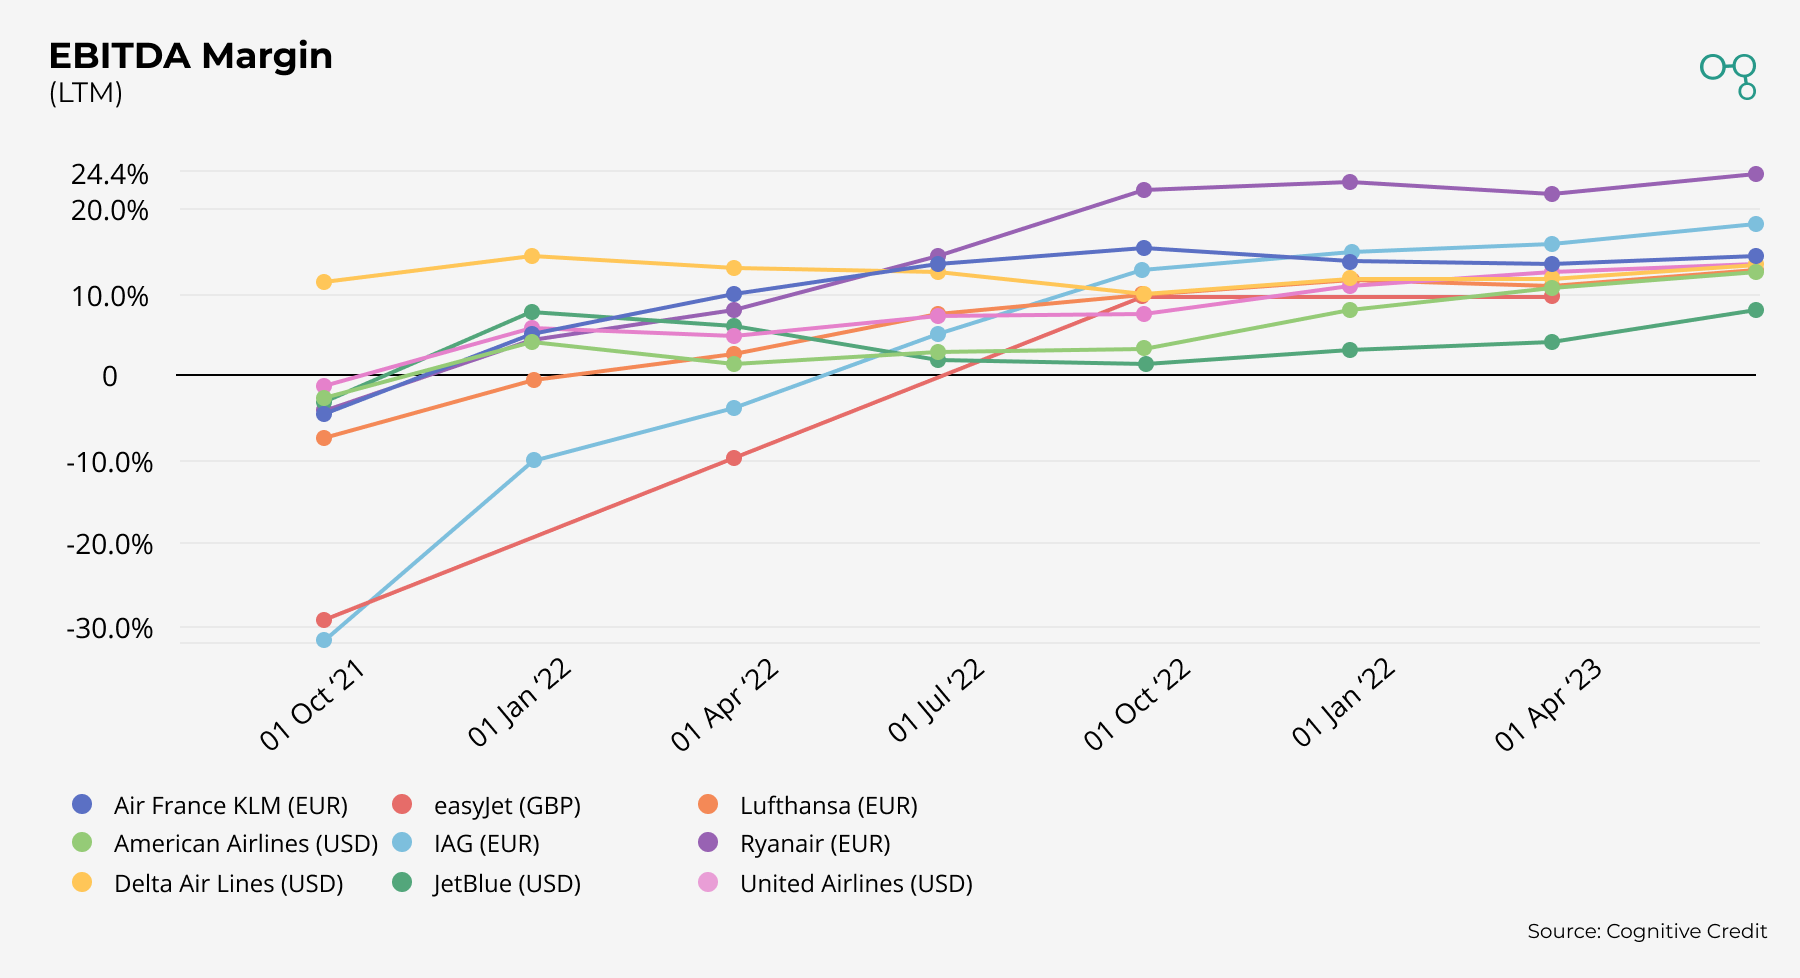
Airlines remained strong heading into the summer season
Some of the trends we observed in the first quarter continued into 2Q23 - notably the ongoing recovery of travel-related sectors, as reflected in ongoing growth in Airlines earnings and margins with our average Airline benefiting from Revenue rising 30% YoY. All Airlines under Cognitive Credit’s sector coverage now have positive EBITDA margins on an LTM basis, with only Easyjet and Wizzair experiencing EBITDA losses in their most recent reporting period, which of course excluded the bulk of the European summer vacation season.
Energy Sector earnings strength switching to Services & Equipment Suppliers
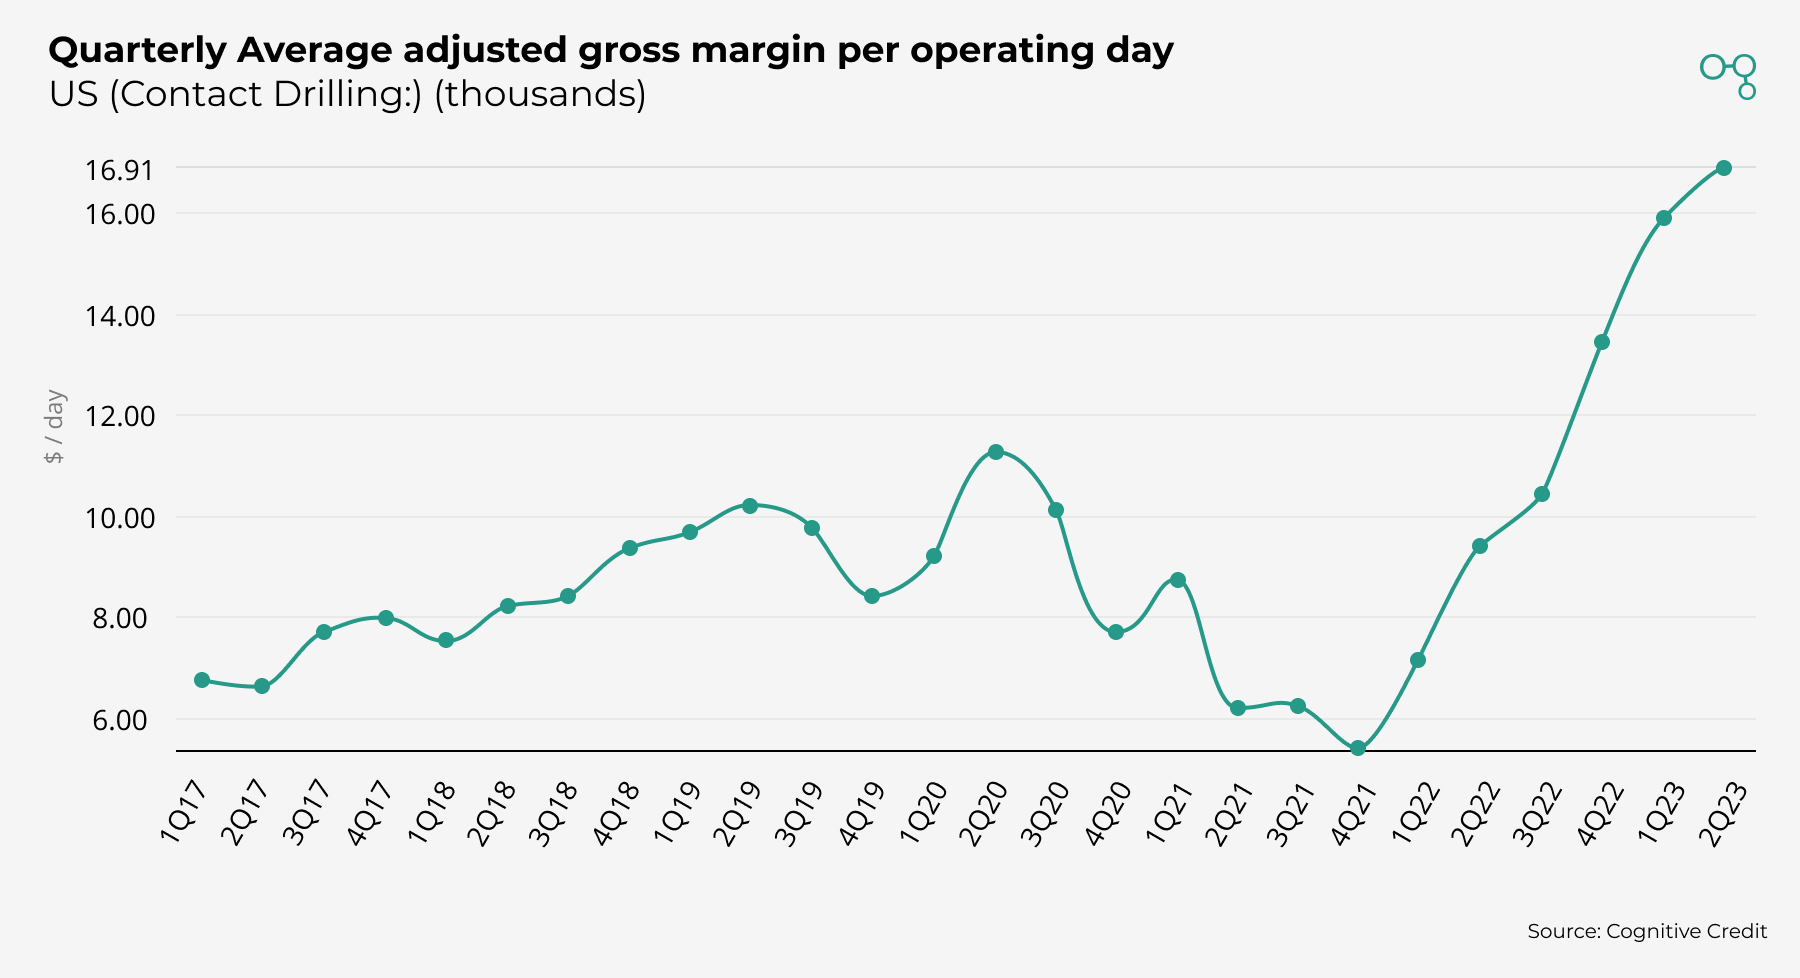
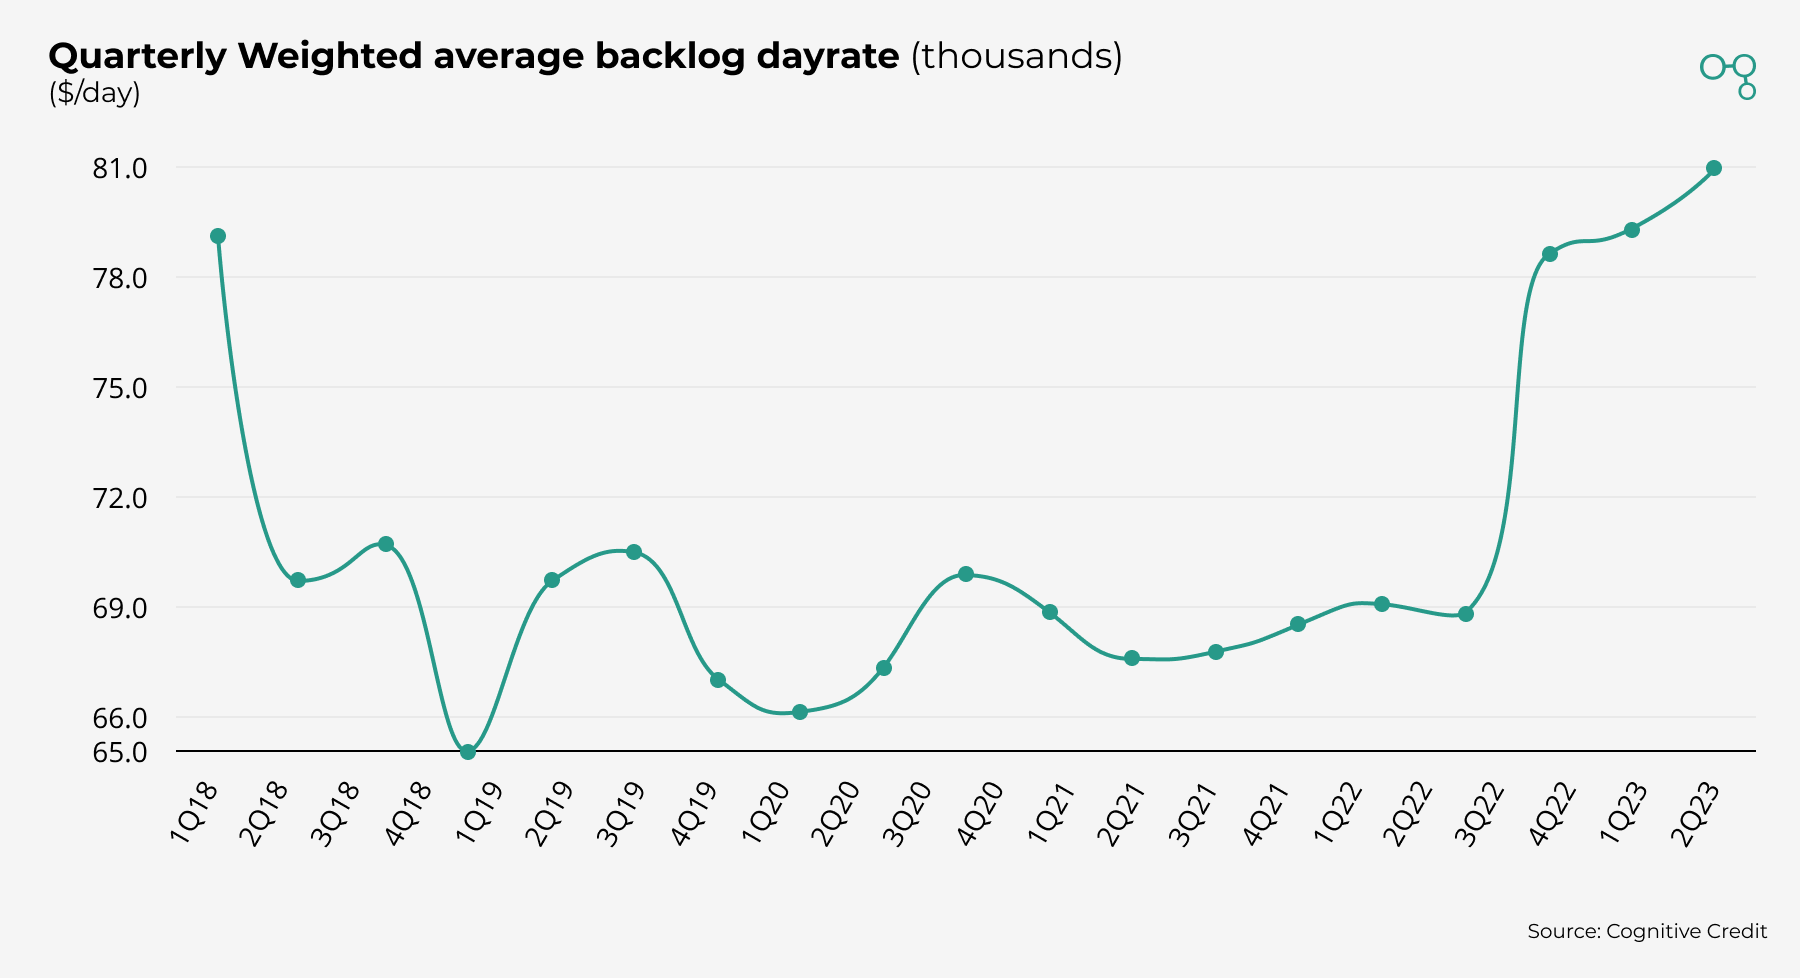
Within the Energy sector, in contrast to the prior quarter, positive performance was only seen within the Energy Equipment & Services subsector (Revenue +16% EBITDA +26% YoY respectively), with Oil & Gas revenue falling (-21% YoY). The latter arose as oil producers’ revenues and earnings suffered in comparison to the peak oil prices realized in 2Q22. However despite lower hydrocarbon prices, demand for Energy Equipment & Services continued at a good pace, allowing suppliers to increase prices and margins - as can be clearly seen in the charts from the KPI section of Cognitive Credit’s Financials pages below.
There have been sustained rises in both UTI Patterson's Gross margin per operating day metrics, as well as Shelf Drilling's average dayrate within its contract backlog:
European auto sector performance accelerated - but for how long?
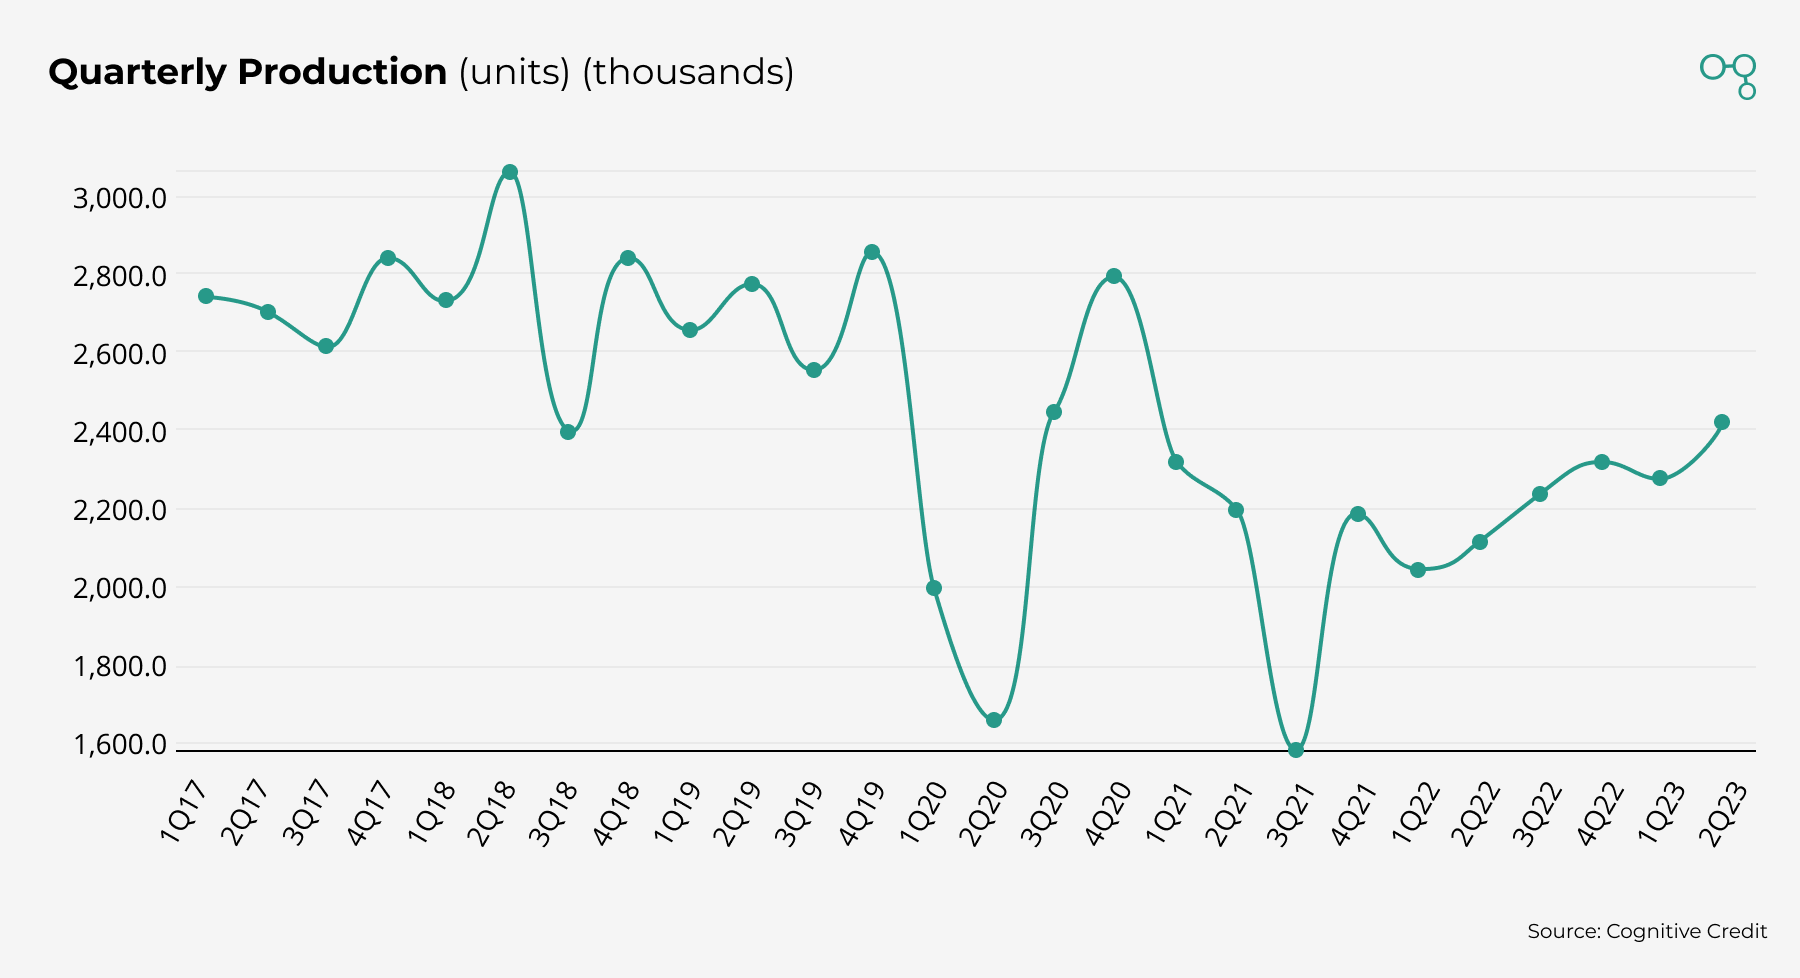
Last year the global automotive industry was facing production constraints, largely due to restricted semiconductor supply. Therefore despite concerns about higher interest rates and consumer weakness, most Automotive manufacturers were still able to increase production levels in 2023, as these production constraints eased, illustrated by Volkswagen’s production figures below:
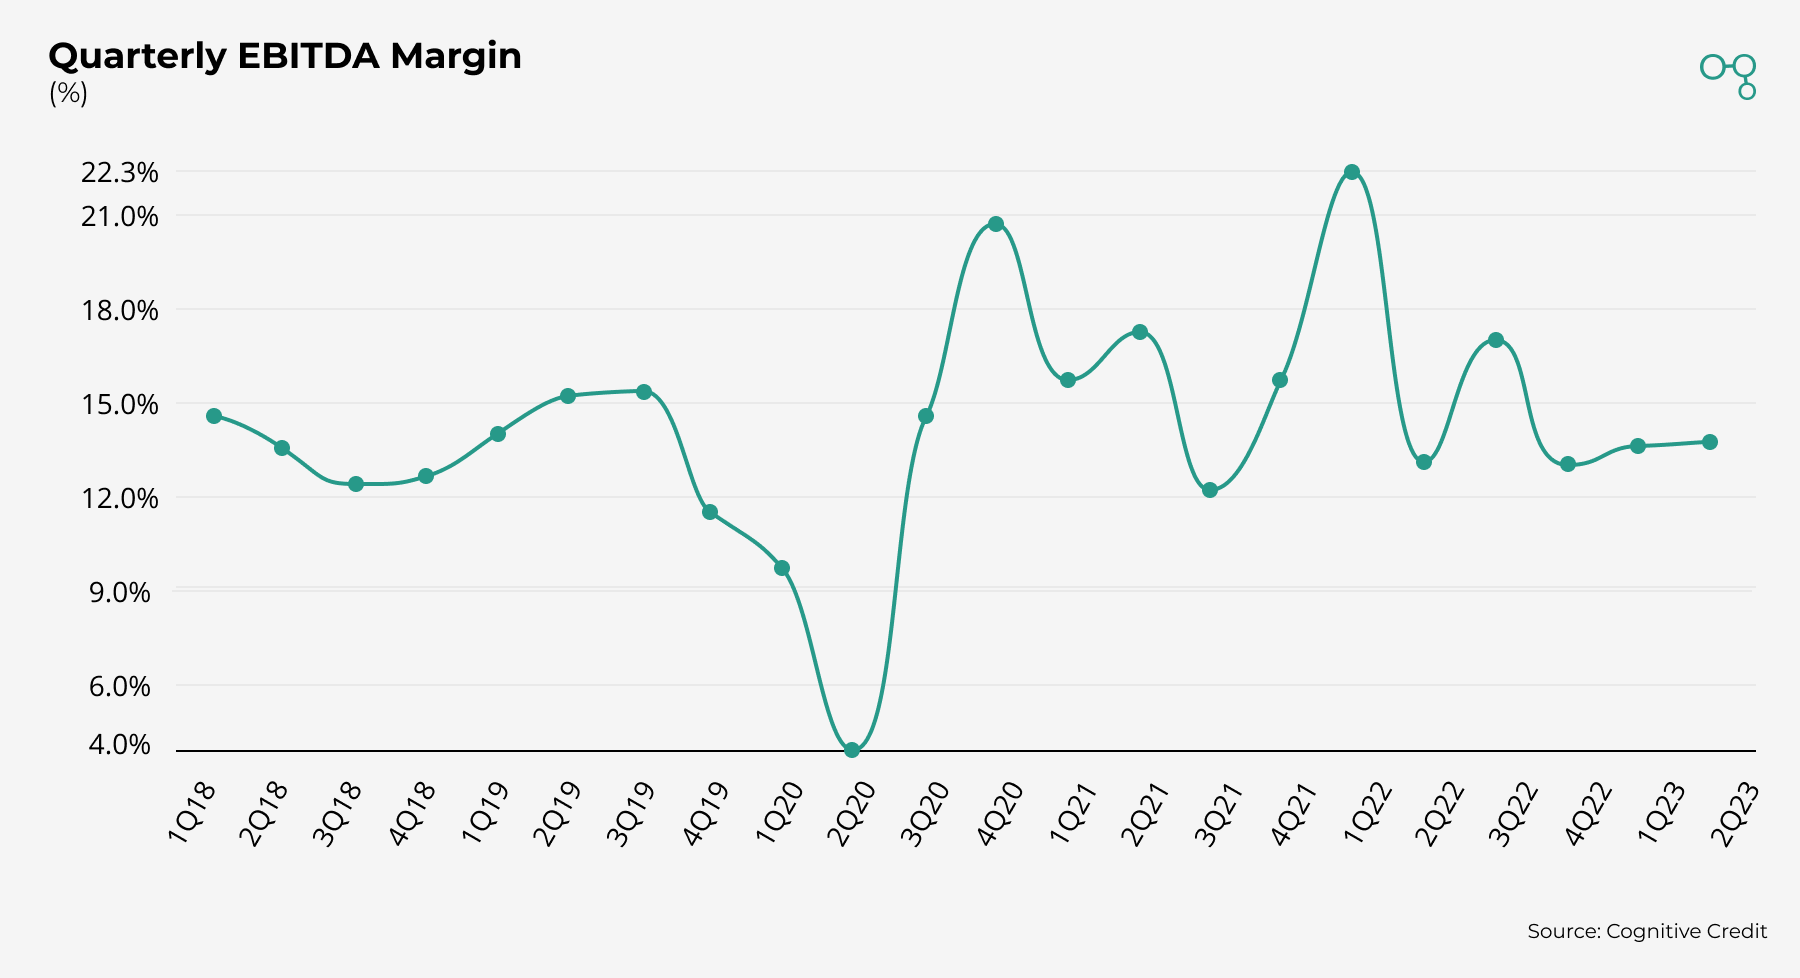
Nevertheless cost inflation did still restrain VW’s margin growth:
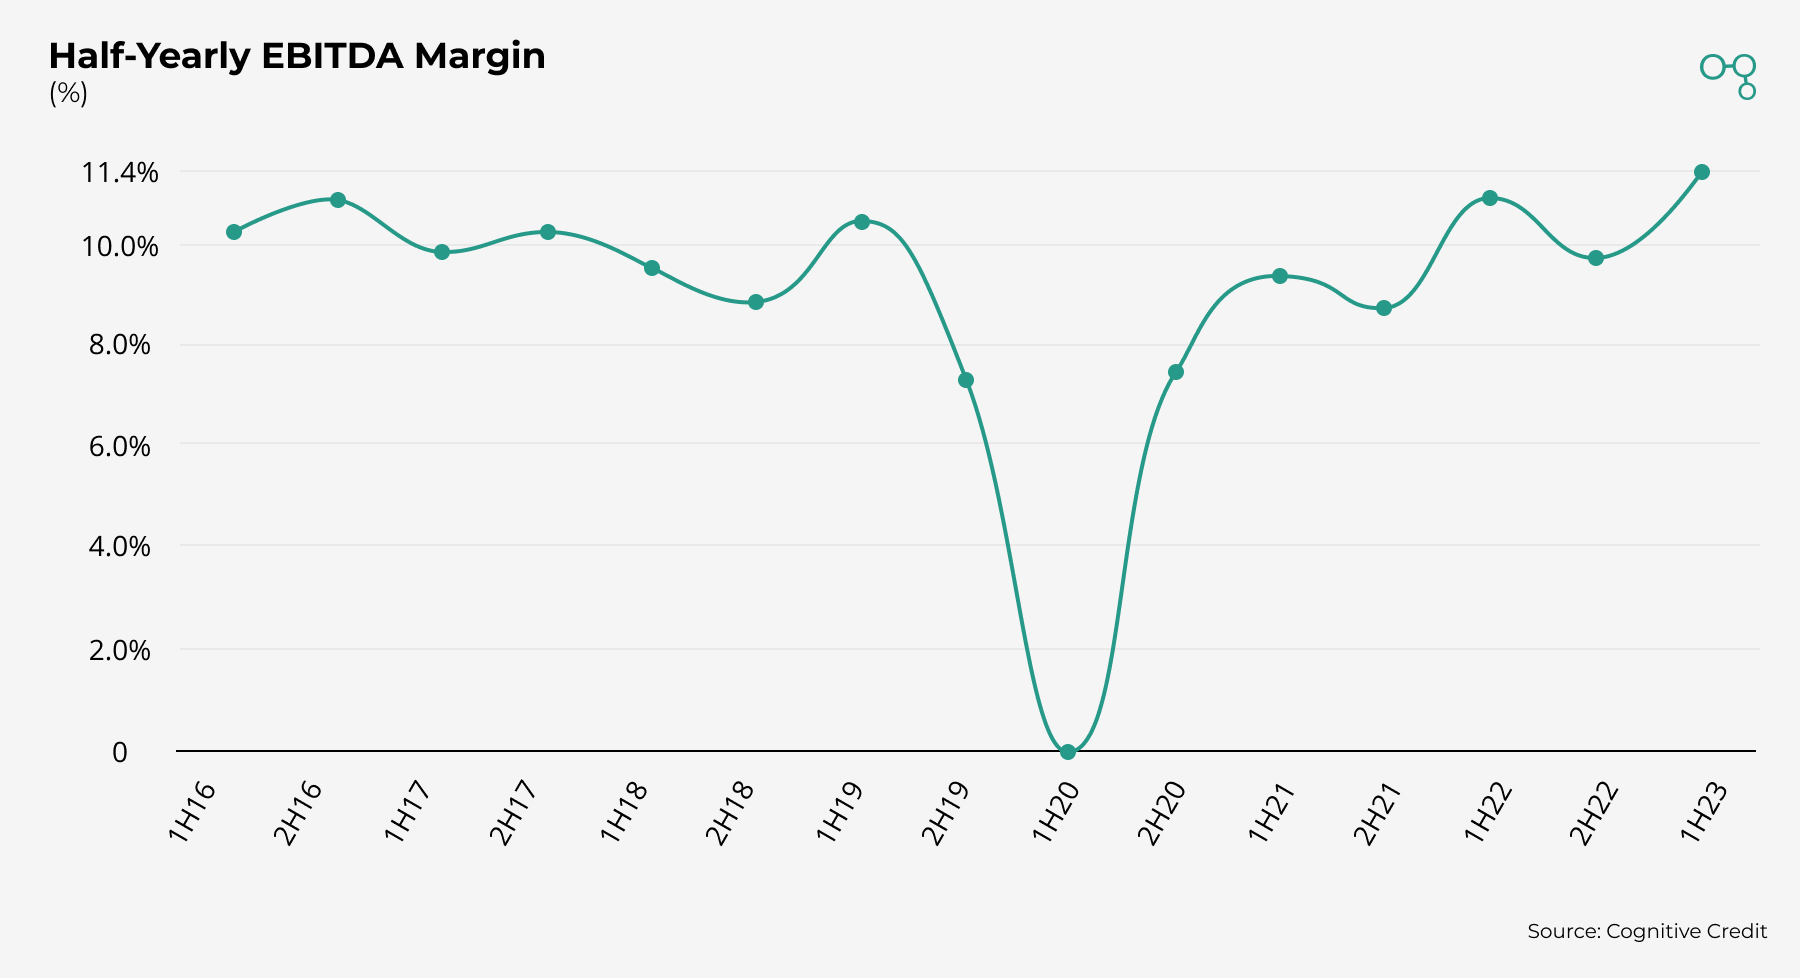
In contrast, Renault’s 1H23 results were coupled with solid cost performance, which coupled with 13% higher production rates and price/mix benefits allowed the Company to generate even higher Automotive margins than before the Covid-19 pandemic. As volumes still have a long way to recover before reaching pre-pandemic levels, this might bode well for the Company’s future profitability, albeit the health of consumer demand in a higher financing-rate environment is a downside risk.
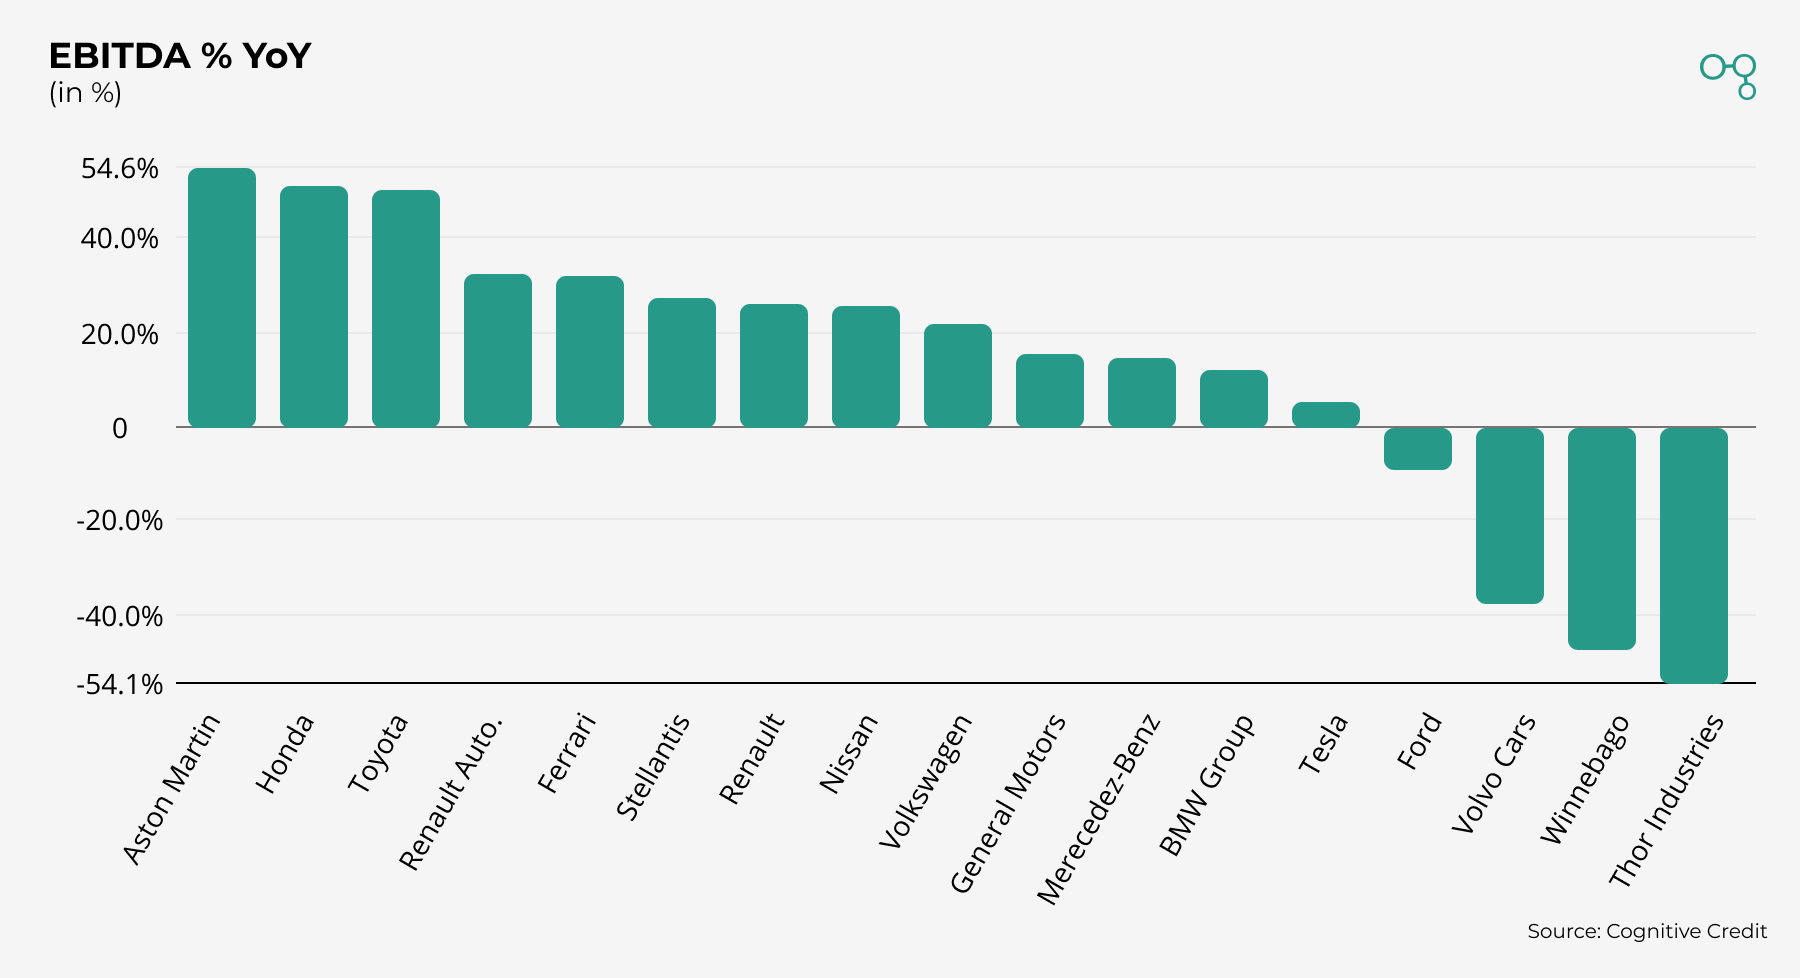
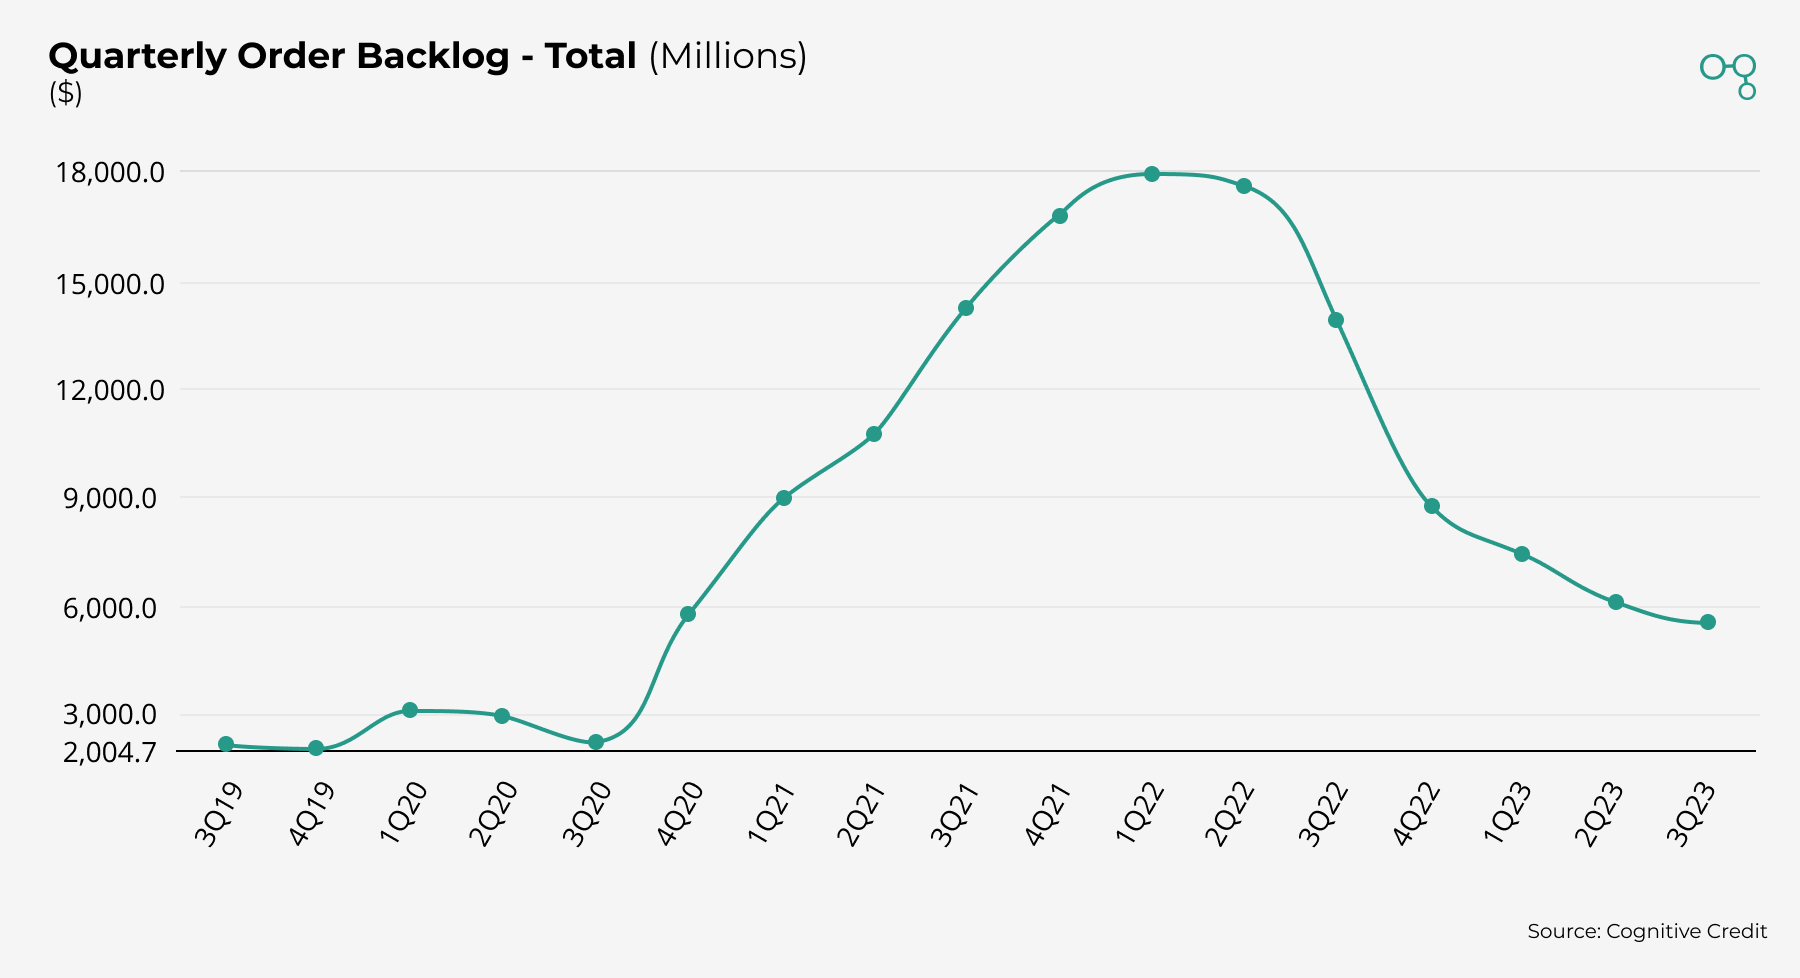
Looking at Automotive Manufacturer EBITDA development across the sector as a whole, whilst Ford and Volvo had some specific (& non-recurring) reasons for YoY EBITDA declines this quarter, US Recreational Vehicle manufacturers Winnebago and Thor experienced sharp earnings reductions. The uncertain market environment has driven dealer destocking actions and hence orders have been falling: Thor’s order backlog has fallen by two thirds since the peak levels of early fiscal-FY22:
Materials Financial Weakness
The general rise in global financing rates is not just impacting real estate (as mentioned in our last piece) but is also driving weakness in construction end-markets, with adverse second-order effects also being experienced in the Building materials and Chemicals sectors. 2Q23 saw broad decline across the Materials space in both Revenue and EBITDA terms (-9% and -22% YoY respectively).
On a sector basis, the Chemicals industry provided one of the weaker quarters with Revenue dropping -14% YoY and EBITDA -42% YoY.
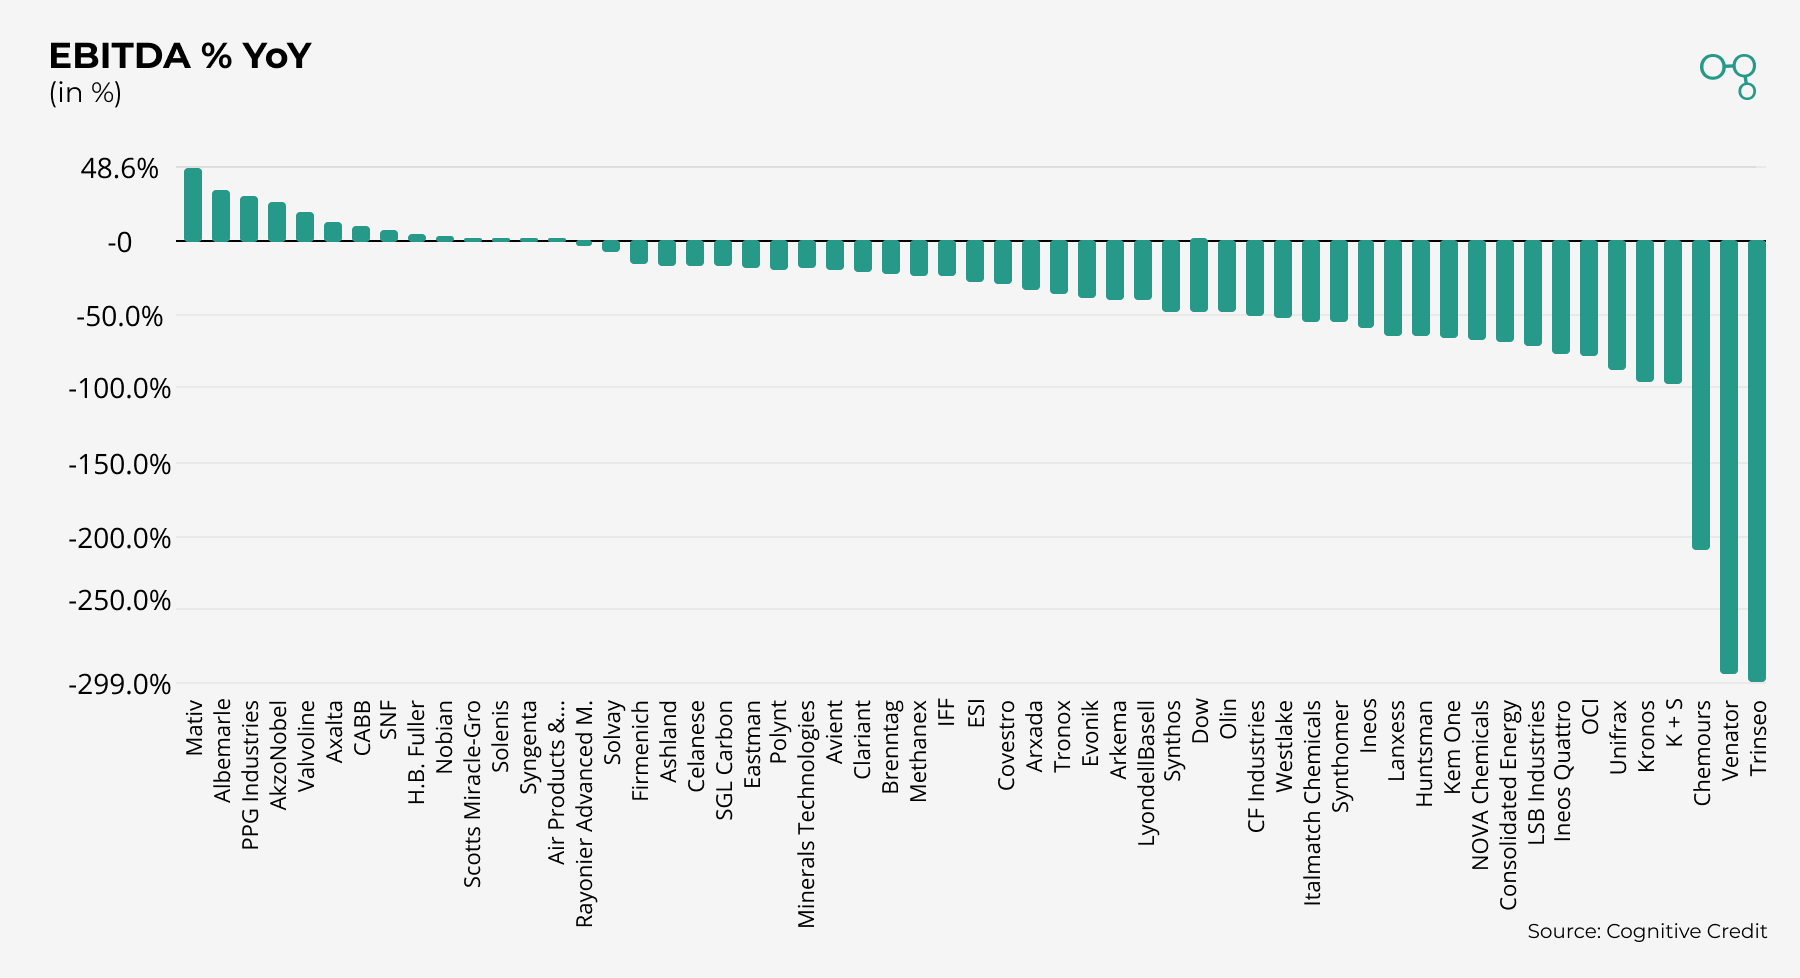
Amongst the weakest performers were some HY credits with particular exposure to construction end markets. Chemours’ Titanium Technologies sector has suffered a sharp slowdown in demand over recent quarters due to its exposure to the coatings industry:
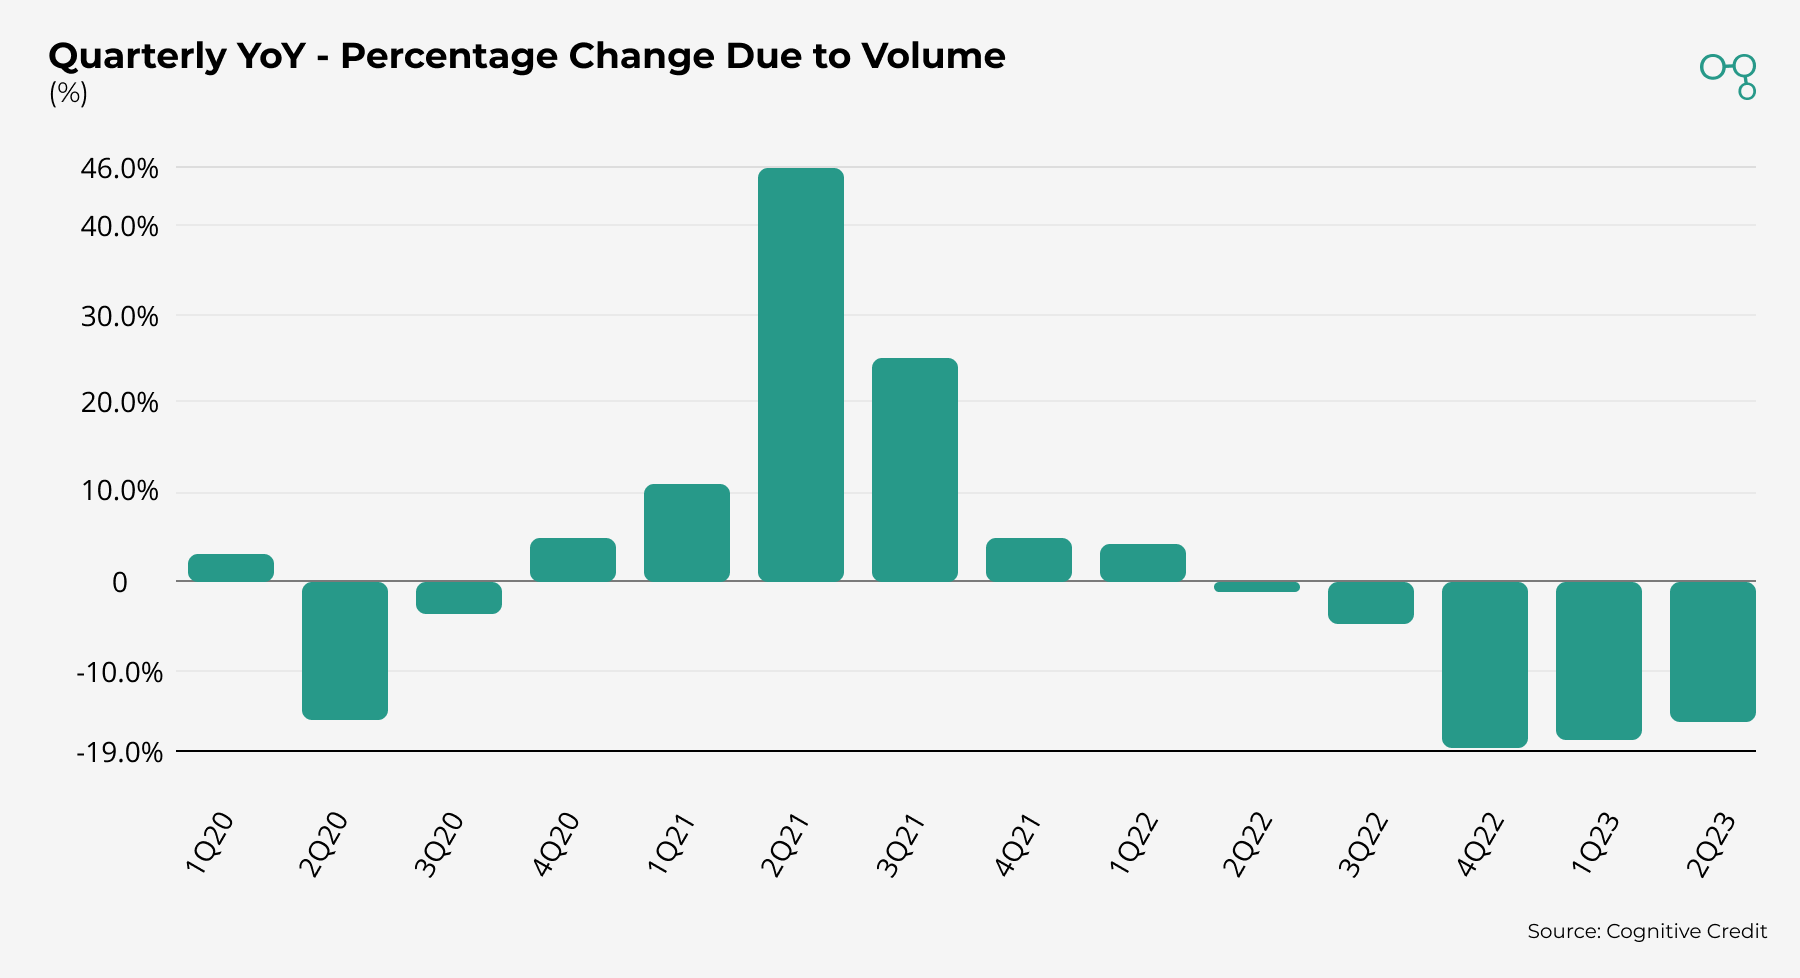
Trinseo suffered the largest YoY EBITDA decline amongst our Chemicals sector coverage, with volume decline triggered by weakness in end markets such as consumer electronics, building & construction and consumer durables.
Looking ahead: 3Q23
Into the third quarter of the year, it will be interesting to see how the ongoing consumer squeeze continued through the summer vacation season (particularly for the recovering Travel sector), as well as observing the varying ability of sectors to continue to pass through inflation to customers. Can the Automotive sector demand hold at these levels as higher interest rates continue?
The launch of Cognitive Credit’s US Investment Grade license will also mean that our 3Q23 earnings review will have a much larger technology component, expanding our coverage of this topical sector.
Analyze the entire market, faster
Cross-market analysis like the above is easy with Cognitive Credit. Our Comparables feature offers a top-down view of all our fundamental data across our three coverage universes (European & US High Yield, and European Investment Grade), allowing you to find relative value opportunities across your markets, sectors and companies quickly and conveniently.
To see our Comparables feature in action, request your demo today.
You might also like
 9 min read
 4 min read
