
By analyzing historical bond volatility, we find that single name opportunities arise more often than we might have suspected. There is always something going on. Importantly, once an initial event occurs, investors need to form their own view, fast, because the opportunity is only just beginning.
I was recently having breakfast with a buy-side PM, recounting a story from my time on the sell-side. On those days where I had a client breakfast, or had been off the desk for a significant length of time, my first question to any of the traders who worked for me was “what’s going on?” If the reply came, “there’s nothing’s going on”, I would always counter (as had been done to me by my boss in the past), “there’s always something going on - you just don’t know what that something is”. This guy nodded his head in agreement, adding that when you have a book of 500+ line items, in his experience, there is always something going wrong, not just going on!
This got me thinking about the distribution of volatility in the credit market, and whether there was empirical evidence to back up the idea that there really is “always something going on” and what credit investors can do to benefit from it.
What do we mean by “something” going on?
When someone asks “what’s going on in the market today?”, what they really mean is “what is happening (world events) causing bond prices (either individually or collectively) to move significantly.” Those events could be earnings reports, macro data, legal proceedings, corporate announcements - anything that results in the market reassessing the fair value of an instrument.
Defining what the “something” is
To do this successfully and extract meaningful insight from the data set, we first needed to define what the “something” is.
Through our market data partnership with S&P Global, we have access to the best source of closing prices for bonds in the global credit space. This data set formed the basis for our analysis of price volatility on a bond-by-bond basis.
We began by looking at a bond’s range over a 5 day period. If the bond’s range (the difference between the minimum and maximum closing price) exceeded a specified threshold (5 points), then we would mark this as an event (the “something”) in our analysis.
For clarity, we’ve added a more detailed methodology at the end of this post.
Result: There really is always something going on!
We initially ran the analysis setting the threshold at 5 points.
Why 5 points? It’s a large enough move to:
- answer the question posed by your boss;
- make investors refresh their view on a name;
- compensate for bid / offer;
Figure 1 shows the number of companies per week that triggered an event, with the threshold set at 5 points.
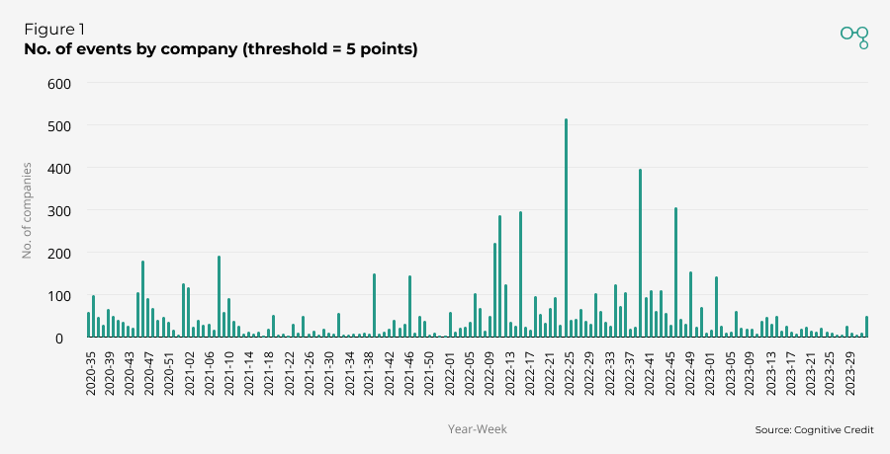
That is a lot of volatility - perhaps more than anyone would have expected.
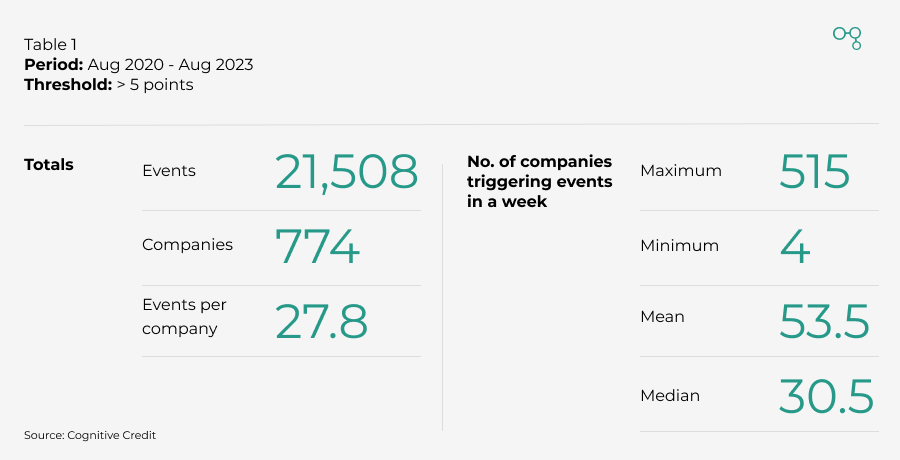
The total number of companies for which there was at least one event was 774, over half our coverage universe. The average number of companies triggering an event per week was 53.5, with the maximum number of companies in a single week 515 and the minimum 4. Table 1 presents these results.
Clear evidence that there is always something going on in credit markets.
Raising the bar: Increasing the threshold to > 10 points
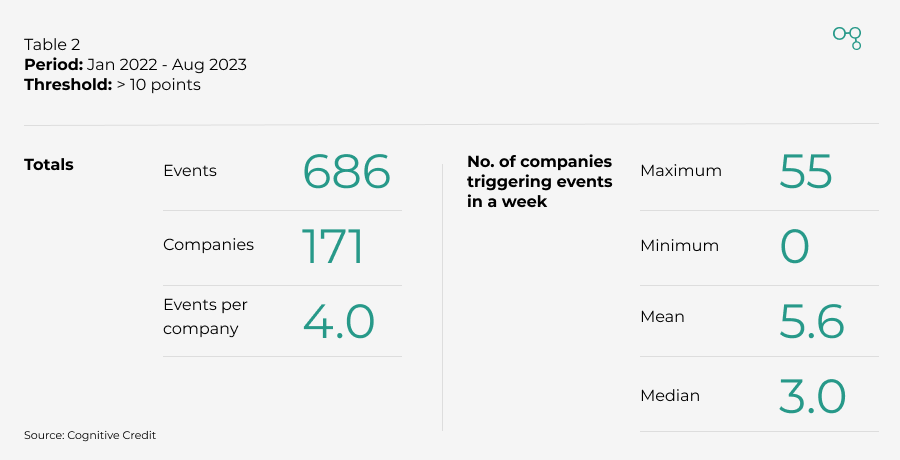
To draw actionable insights from our findings, we decided to increase the threshold to 10 points and narrow the period we covered from January 2022 to August 2023. Based on this criteria, there were events on 357 different bonds from 171 different companies, representing a combined notional of > $375 billion.
Figure 2 shows the number of events, by company, that occurred for every week since January 2022 with the threshold set at 10 points.
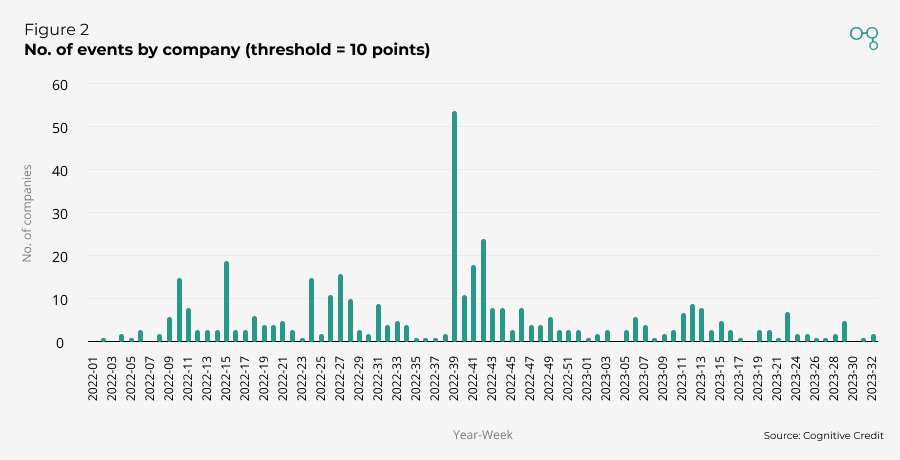
The maximum number of unique companies triggering an event in a week was 55, in the week beginning 26th September 2022. The week after the Liz Truss / Kwasi Kwarteng mini-budget, after which the Gilt market experienced significant volatility.
The mean number of companies triggering events per week is 5.6. This number is clearly skewed by the outlying weeks. The median number of events per week was 3. This is presented in Table 2.
In an average (mean) week, there were 5.6 names with price moves above 10 points, and at a 5 points, that rises to 53.5 (Table 1). I guess my boss was right when he said, if I thought nothing was going on, it wasn’t because there wasn’t, I just didn’t know where to look.
Great analysis - but what’s the point if I already missed the move?
While it’s an interesting exercise to review all these events over time, ultimately credit investors watching price moves are searching for opportunities, and historic moves are by definition in the past. So how do we think about the relationship between this historical volatility and what they imply for future opportunities?
The easy answer is, yes, of course these moves create opportunities. Mean-reversion strategies are well documented and are a strong theme across financial markets, credit included. By analyzing the data, we found another trend that creates a clear opportunity after an event has occurred. Volatility generates more volatility: once a bond experiences an event, it becomes more likely that there will be future events on that same bond.
Put simply, once the first >10 point move has occurred, you should expect more >10 point moves in the future. The same is also true when the trigger level is set at 5 points.
Of the 171 companies that triggered an event when the threshold was set at 10, in the period January 2022 - August 2023, 82 of those companies triggered more than 1 event in total, as summarized in Table 3.
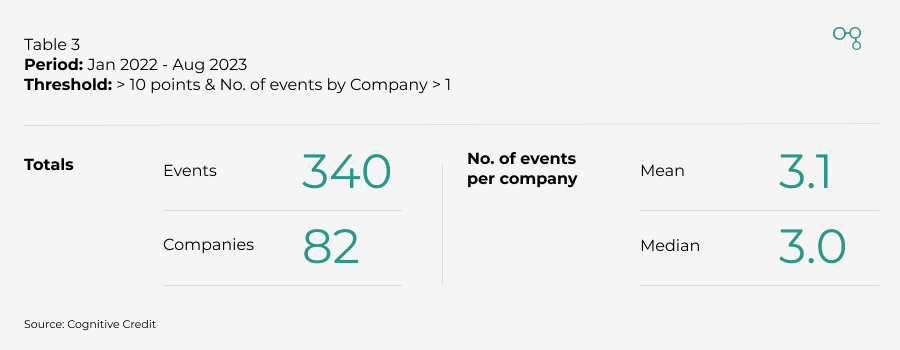
The average number of future events, after a company has triggered one event, is 3. If you missed the first 10 point move, there were, on average, another 3 times you could try to capitalize on a move of that speed and magnitude for the same company. So credit analysts – you haven’t missed your chance after the first move, but you don’t want to waste time getting ready for the follow-on activity.
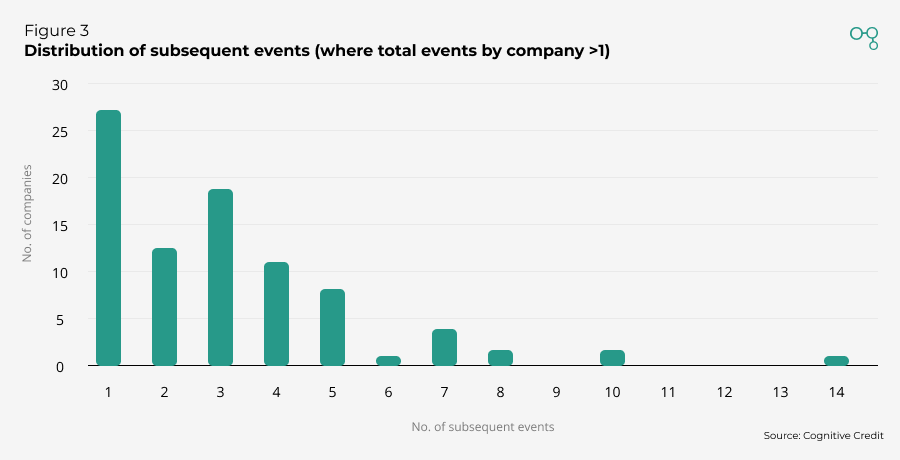
Figure 3 illustrates the frequency with which events occur after the first event has triggered. To be clear, 27 companies triggered 1 subsequent event after the triggering of a first event, 12 companies triggered 2 more, 14 companies triggered 3 more, and so on.
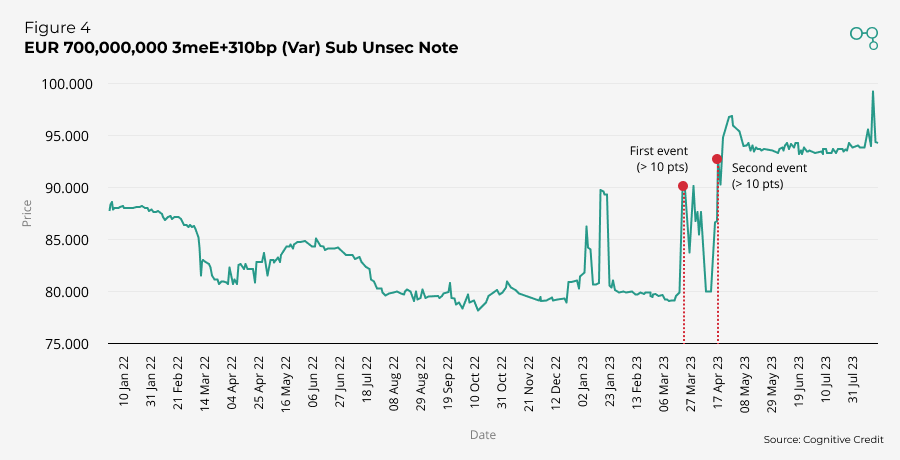
Bringing the analysis to life: A specific example
This is a EUR700m single-B bond in the Food & Agriculture industry. While exhibiting price volatility that would have broken the > 5 point threshold in 2021, it didn’t break the > 10 point threshold until March 2023, triggering another > 10 point event in April 2023. The price action in this bond gave investors multiple opportunities to capture alpha over a 4 month period, and that opportunity persisted after the first 10 point event was triggered. And this is just one example, there were another 81 similar instruments identified by our analysis.
Conclusion
Idiosyncratic risk creates opportunities for credit investors, but these opportunities can quickly turn into headaches for credit analysts who are required to form views on new situations as soon as they materialize.
Since the beginning of 2022, there has been an average of 2 new companies triggering 10 point events a week across our three coverage universes (European High Yield, European Investment Grade and US High Yield). That’s a lot of new situations for credit analysts to form views on. As we’ve shown here, you can’t ignore these initial moves because volatility in one period is a good predictor that it will continue over time.
As we’ve discussed before, forming a view on any one credit is still too challenging. Forming and maintaining a view on the full market, with so many names experiencing multiple 10pt+ bond price moves is next to impossible.
Fortunately, Cognitive Credit delivers the comprehensive market coverage and data update speed to empower investors to capture all of these opportunities across the European and US High Yield and Investment Grade markets. To find out more about our application can supercharge your credit analysis, request your personal demo today.
Detailed methodology
The bond’s range is defined by subtracting the maximum from the minimum closing price of the last 5 business days. This range was recalculated every day, discarding the oldest closing price and introducing the new day’s closing price. Of course if we included intraday pricing the number of companies triggering events would likely be even greater.
Table 4 presents a worked example:
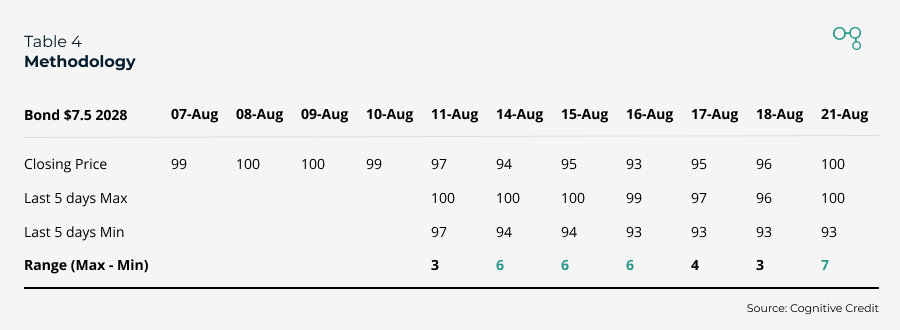
We established the threshold, initially, at 5 points.
We didn’t count continuous sequences of a bond breaking the threshold as multiple events, and so we de-duplicate consecutive events where the range > threshold, as occurred in Table 4 on 14 - 16th August. Once an event had occurred, there had to be at least 1 working day where the range < threshold before a new event could be registered.
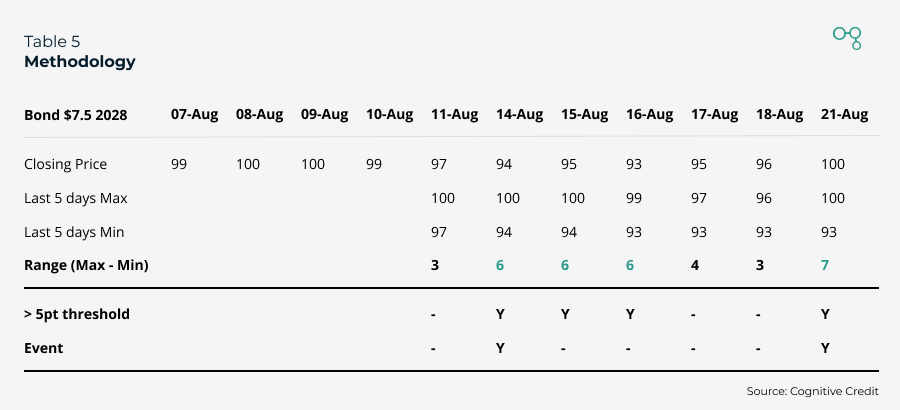
In Table 5, the Range > Threshold on 4 occasions, but there are only 2 events.
Finally, we wanted to ensure that we were analyzing an opportunity set that global credit investors would look to take advantage of. Therefore we excluded convertibles, inflation linked notes, issue sizes less than 250 million (USD normalized), amounts outstanding less than 250 million (USD normalized) and only looked at bonds in USD, EUR and GBP. We also ensured that only 1 of RegS or 144A bonds were included in the analysis when a company had both types in issuance.
(Note: This post was produced jointly by Jack Wearne and Tom Willers.)
You might also like
 2 min read
 5 min read
