
With FY23 earnings behind us, we take a look at the data from the latest earnings cycle and identify more interesting observations across US markets and sectors.
As each quarterly earnings cycle ends, we take some time to analyze the enormous amount of data we process with our Comparables feature - a powerful tool to view markets and sectors top down and in their entirety - to see what sector trends jump out at us across our current coverage universes.
Without further delay, here's our Quarterly Earnings Breakdown for FY23 - US Edition.
Strong rebound in Consumer Services revenues driven by Hotels, Restaurants & Leisure spending
A continued recovery in consumer spending was apparent throughout FY23 as annual revenues in US Hotels, Resorts, and Cruise Lines increased an average of 30% vs the prior year.
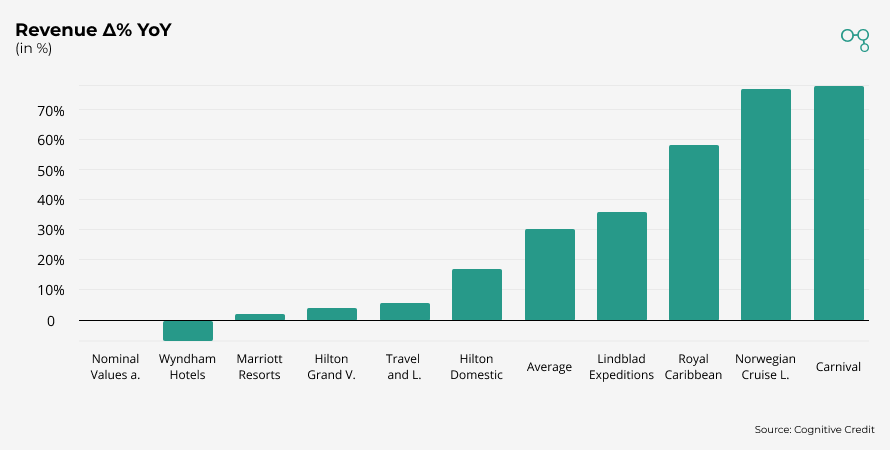
Revenue growth in Cruise Lines was outstanding, with Carnival and Norwegian leading the pack. Both posted year-over-year increases in the mid to high 70% range with EBITDA increases of over 300%. While the nominal YoY rates of increase moderated each quarter as 2022 comps got tougher, the trend nonetheless demonstrated impressive durability with the top line growing at 41% and 31% respectively in 4Q’23.
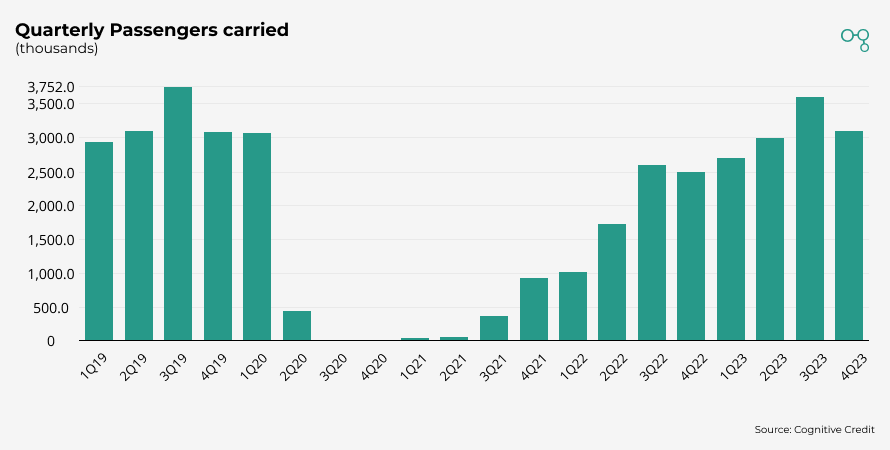
Key performance indicators released by each company demonstrate the foundation of this robust demand. Quarterly Passengers Carried at Carnival surpassed the pre-covid level for the first time in the latest quarter (3.1mm in 4Q’23 vs 3.07mm in 4Q’19).
Carnival’s occupancy also steadily recovered over the past 12 quarters and has retaken the 100% level. 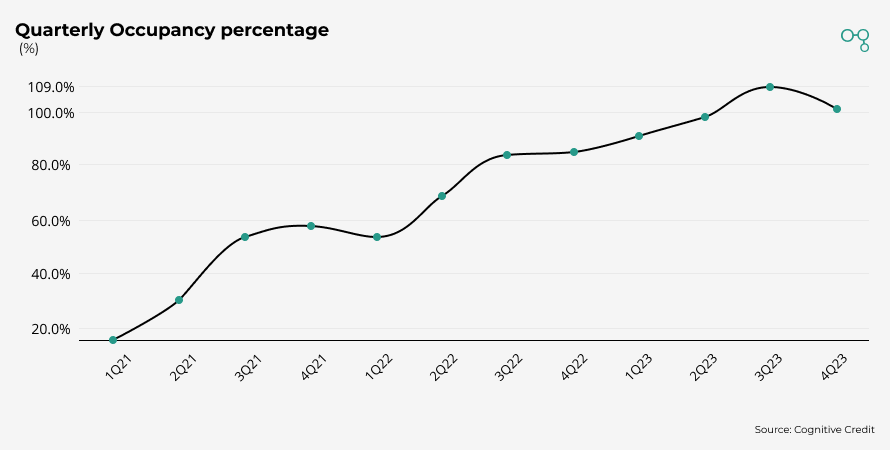
Similarly, Passenger Cruise Days at Norwegian have now surpassed pre-covid levels.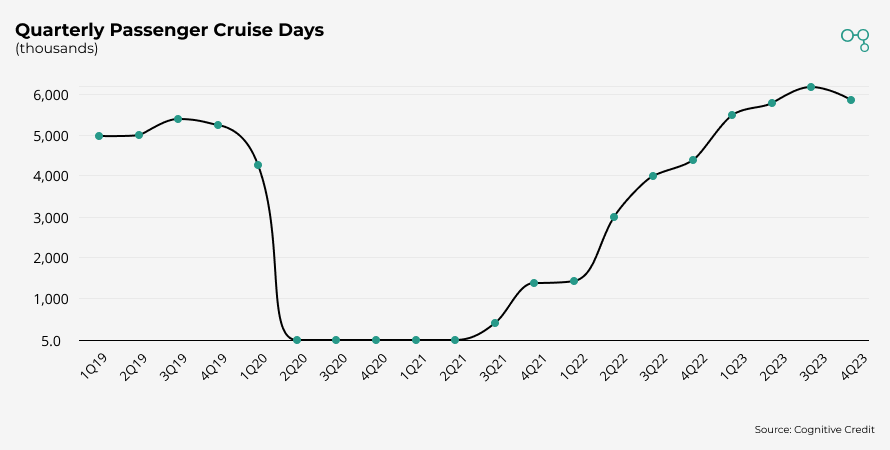
The US Casinos and Gaming space observed similar trends, with sector revenues up 27% year over year and sector EBITDA more than doubling. We have observed a massive deleveraging in names like Las Vegas Sands and Wynn Resorts over the last 4 quarters driven by this EBITDA growth.
Las Vegas Sands Adjusted Net Leverage since FY21: 
Robust spending in US Aerospace & Defense reflects tension in the global geopolitical environment
In the face of a more uncertain geopolitical environment across the world, revenue growth in the Aerospace & Defense sector was nearly triple that of the broader market, with the top line up 17.5% for US HY names and 10.1% for US IG names. Growth was broad based across the sector, reflecting a growing market; every company in the space posted a YoY revenue gain. 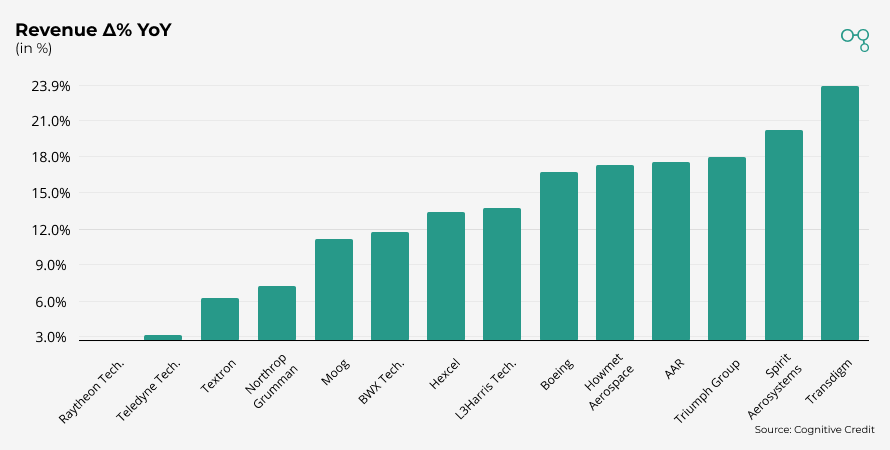
Transdigm, a leading provider of engineered components for commercial & military aircraft, posted an industry leading 24% increase in FY23 revenue. It has delivered double-digit growth for eight consecutive quarters and a marked improvement in Free Cash Flow / Total Debt.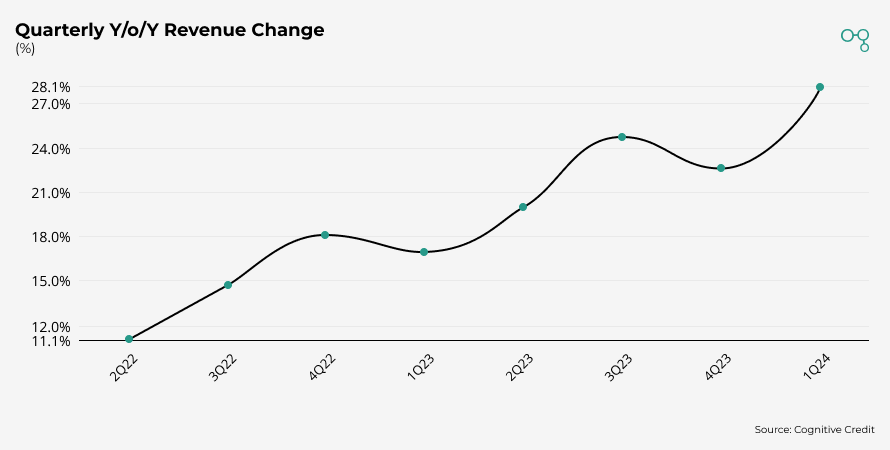
At Howmet Aerospace, a 12-quarter trend in the core Engine Products segment continued its impressive momentum, with sales increasing at a CAGR of nearly 19%. 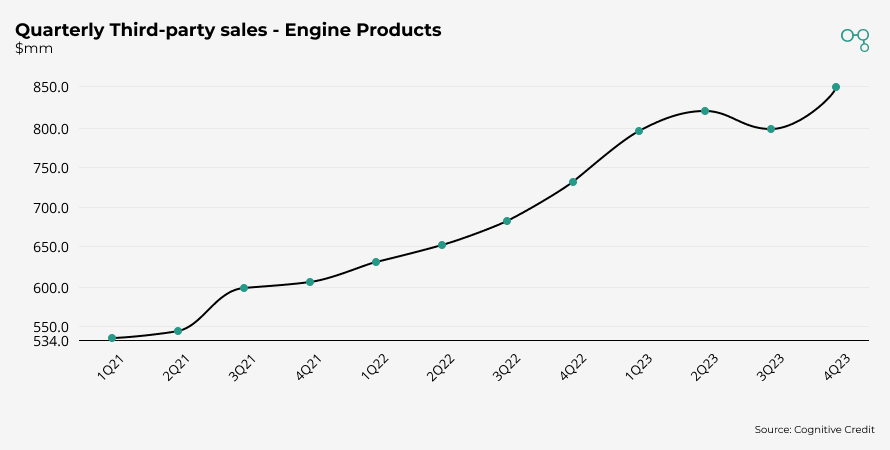
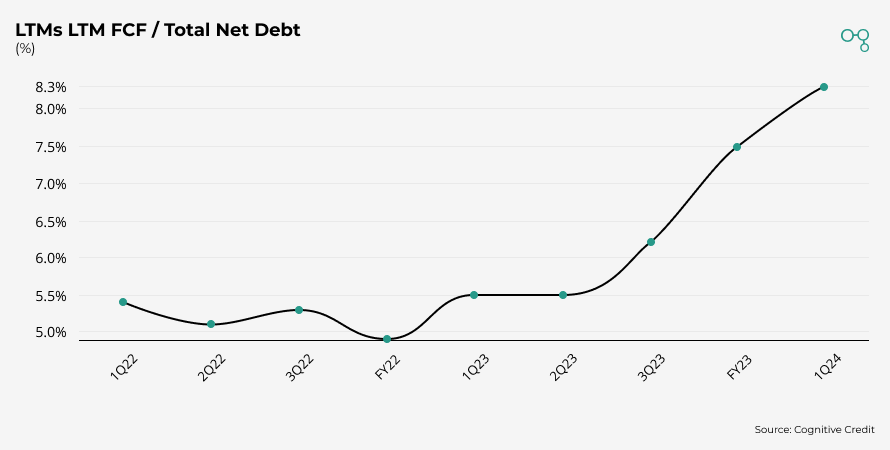
This has contributed to sequential EBITDA growth for 12 straight quarters and a material improvement in the credit story, as evidenced by the company’s climbing interest coverage ratio.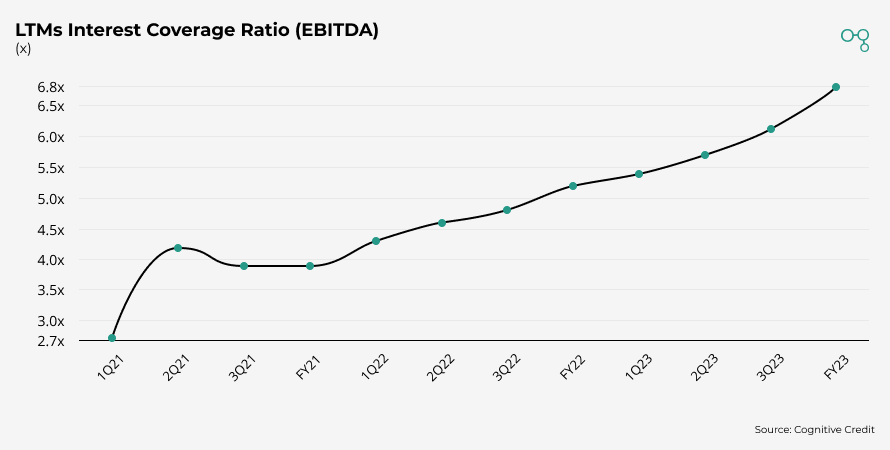
Pharmaceuticals profitability under pressure
The FY23 story was more challenging in US Pharmaceuticals. Regulatory scrutiny and the increasing presence of generics have reduced pricing power, while costs are ticking up due to increased litigation and R&D spending as legacy patents expire. Average revenues for the sector were flat (-0.2%) while EBITDA was down 29%.
One example in the IG space is Viatris, which saw revenues down 5.1% while total operating expenses increased 16.2% due to rising R&D and litigation costs. EBITDA margin declined by 230bp.
Within HY Pharmaceuticals, margins continued to deteriorate at Mallinckrodt as a result of increased competition, scrutiny around specialty pharmaceutical spending, legal action, and slower than expected returning patient volumes. This reduced profitability has brought the company’s fixed charge coverage ratio to a fresh low of 0.7x.
Significant pullback in the Materials sector, led by Chemicals
Finally, we saw a substantial decline in the materials sector in FY23, particularly in the Chemicals subset. Of the 20 largest names in the sector by revenue, only 5 were up year over year, and sales declined by 10.3% in aggregate.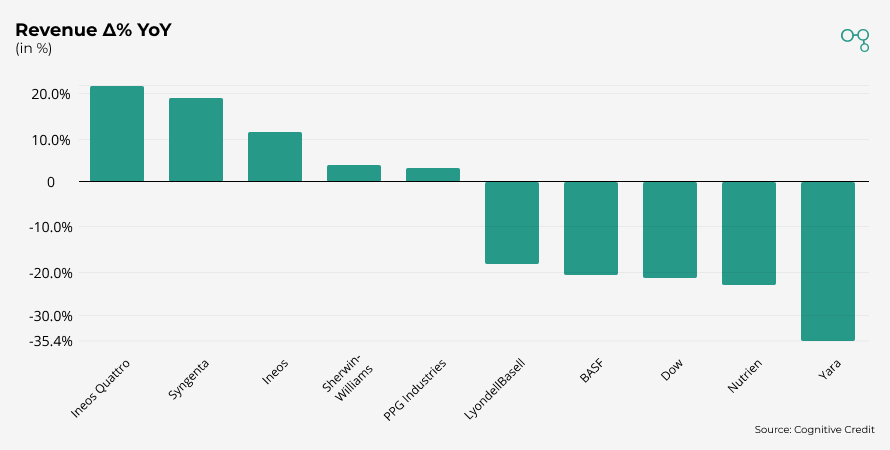
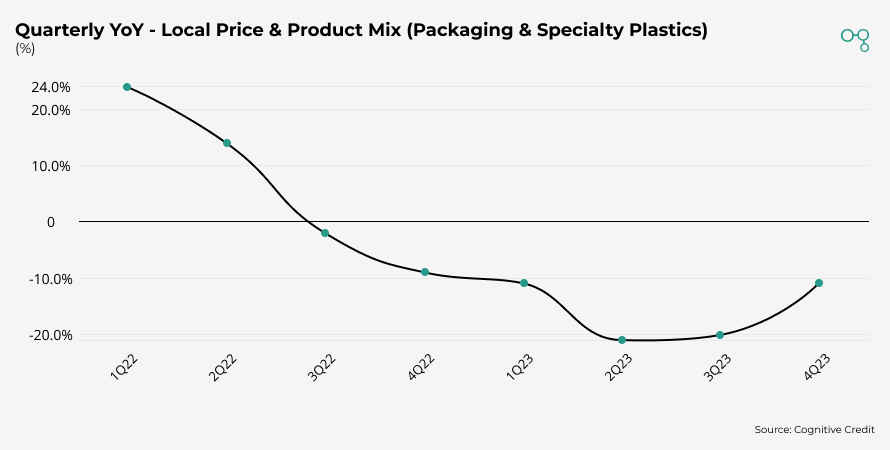
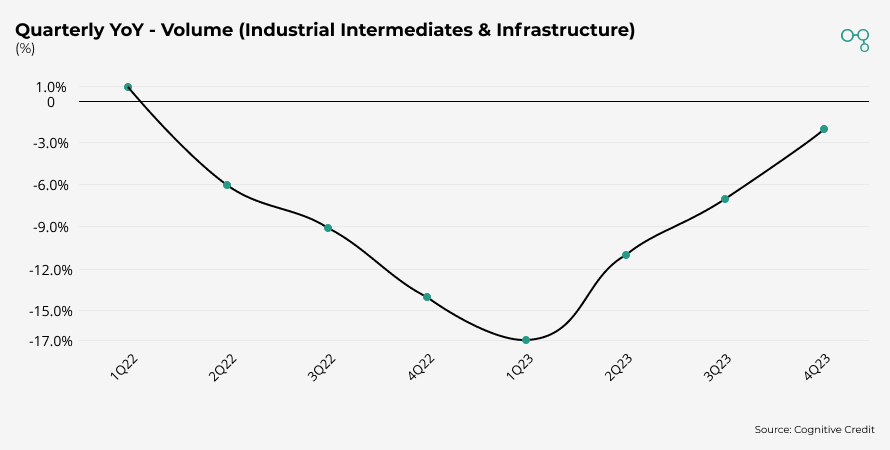
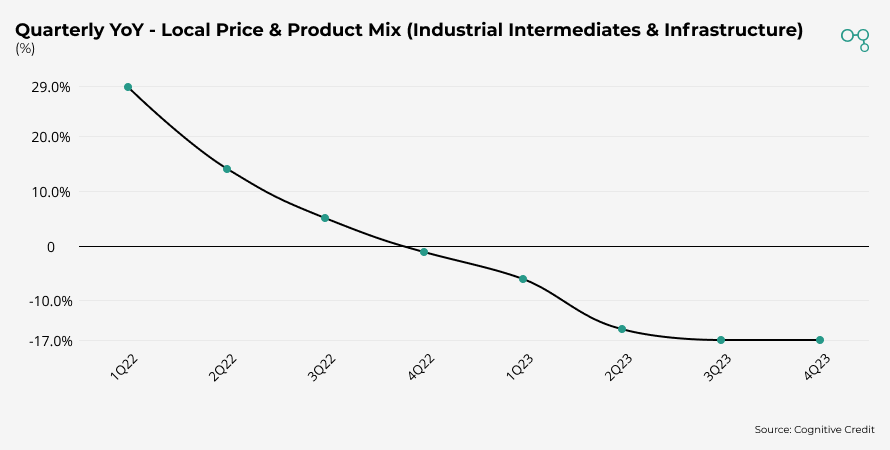
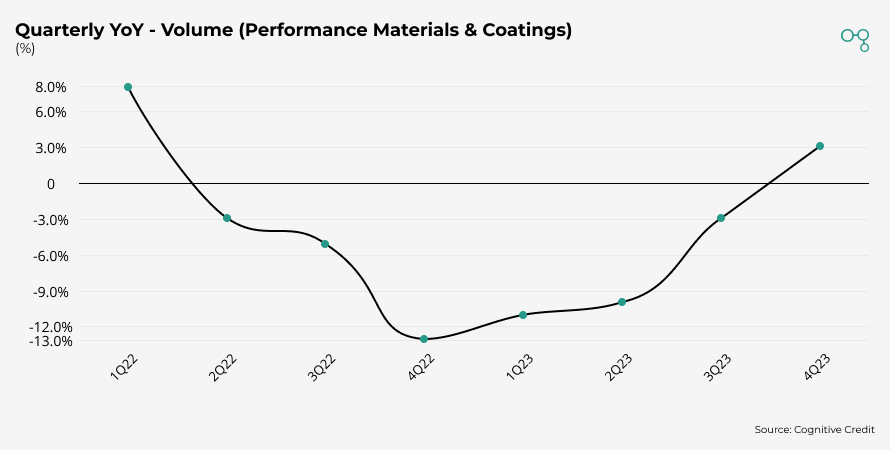
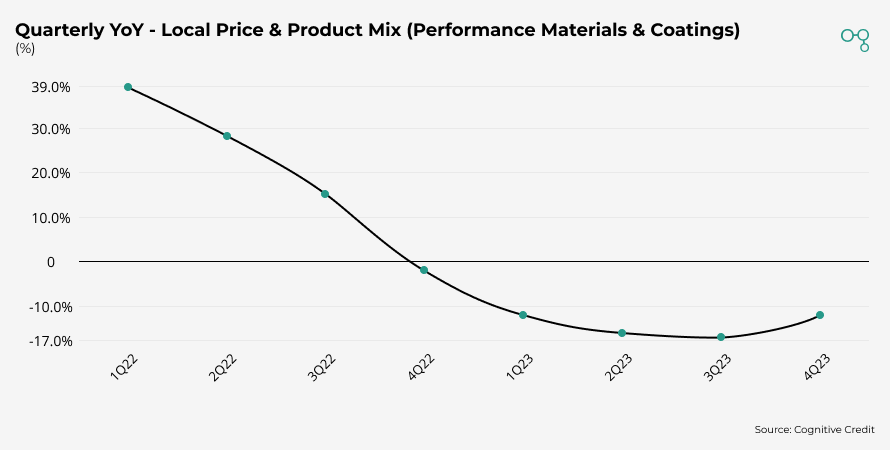
The largest company in the space, Dow Chemicals, saw sales down 20% or more in each of its 3 operating segments, with both price and volume under pressure. Volumes demonstrated a meaningful recovery in the latest quarter, but pricing trends remained more subdued. 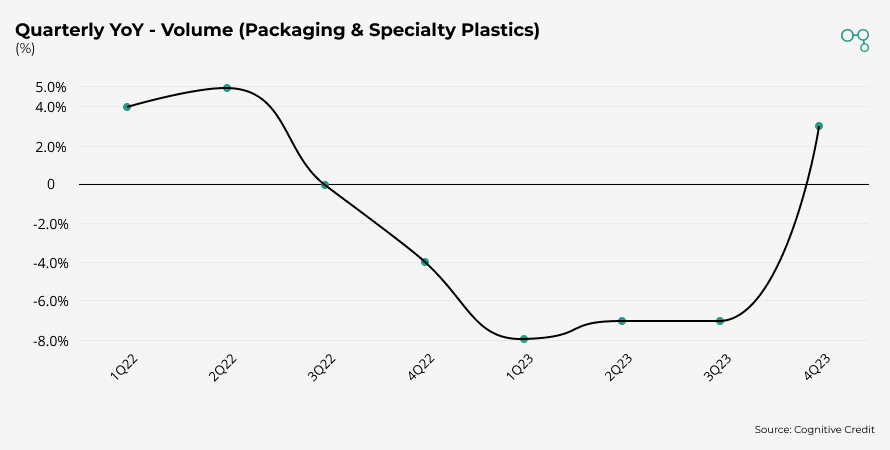
Similar price and volume pressures at Huntsman Chemicals have driven a materially weaker Free Cash Flow profile over the last four quarters. Despite this, HUN credit spreads are trading at their YTD tight. 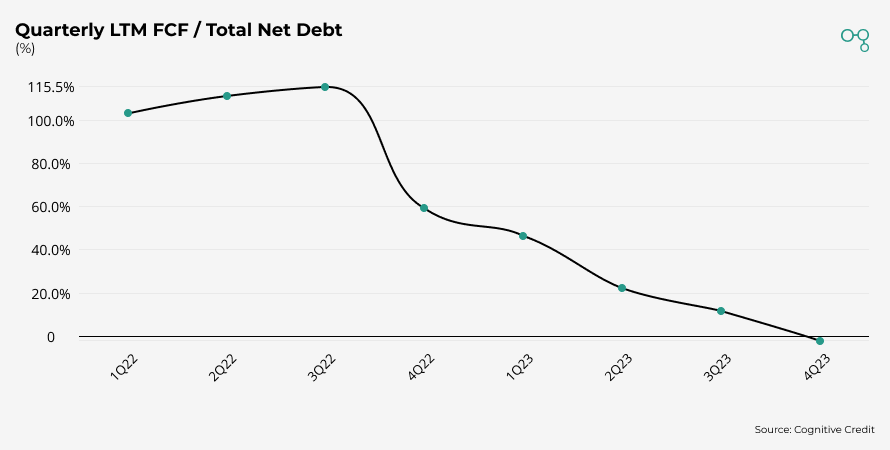
FY23: By the numbers
And to round things off, here’s a quick look at how much earnings data was processed in our US coverage during the FY23 earnings cycle: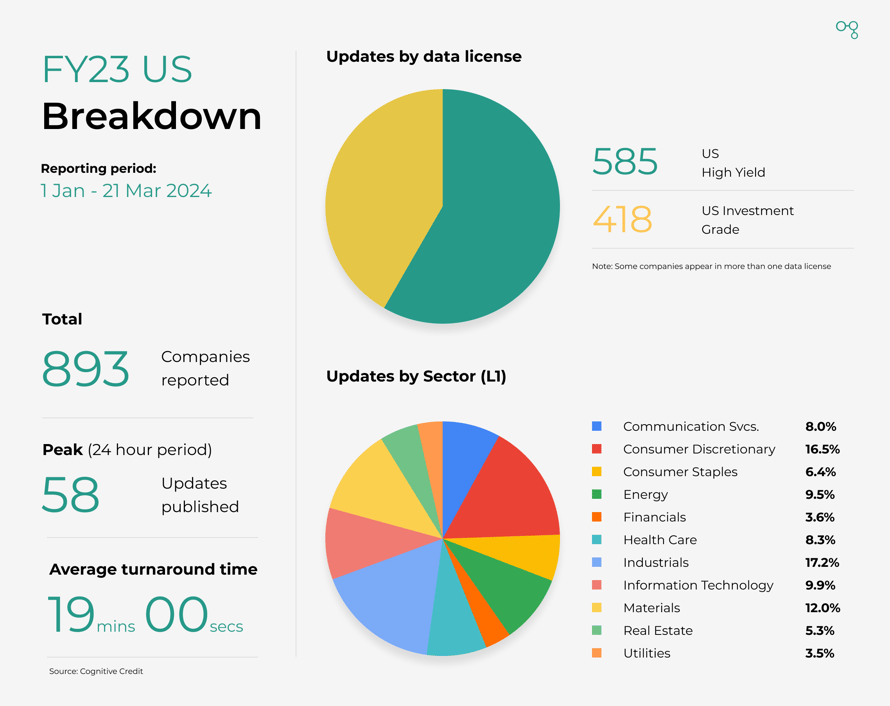
Looking ahead
Looking ahead to 1Q24, we expect investors to closely follow KPI’s underpinning consumer demand to gauge the durability of the post-covid spending revival. We also expect investors will pay increasing attention to companies with the combination of deteriorating fundamentals and near term refinancing risk. Market price action has been largely broad based across companies and sectors in recent months.
Could the market start to price in more fundamental differentiation between credits in 1Q24?
Analyze the entire market, faster
Cross-market analysis like the above is easy with Cognitive Credit. Our Comparables feature offers a top-down view of all our fundamental data across our four coverage universes (European & US High Yield, and European & US Investment Grade), allowing you to find relative value opportunities across your markets, sectors and companies quickly and conveniently.
To see our Comparables feature in action, request your demo today.
You might also like
 2 min read
 5 min read
