Our analysts take a look at the data from the 1Q24 earnings cycle and identify more interesting observations across European markets and sectors.
As each quarterly earnings cycle ends, we take some time to analyze the enormous amount of data we process with our Comparables feature - a powerful tool to view markets and sectors top down and in their entirety - to see what sector trends jump out at us across our current coverage universes.
Without further delay, here's our Quarterly Earnings Breakdown for 1Q24 - European Edition.
Cruise Lines Propel European Hotels, Restaurants & Leisure Sector’s Growth in Q1 2024
The recovery in the Hotels, Restaurants & Leisure sector, which was noted in our US Quarterly Earnings Breakdown for FY23, persisted into the first quarter of 2024 within the European market. This continued success was largely fueled by the performance of Cruise Lines. Notably, both Hurtigruten Group and TUI Cruises experienced significant year-over-year growth in revenue (15.8% and 9.9%, respectively) and EBITDA (204.2% and 54.9%, respectively).

TUI Cruises reported a 10.8% increase in revenue from operations, reaching €493 million, while operating expenses decreased by 2.2% to €348 million. This revenue growth was driven by a significant rise in both occupancy levels and average ticket rates. Consequently, the EBIT margin improved considerably (23.1% in Q1 2024 compared to 13.9% in Q1 2023), contributing to the company’s ongoing de-leveraging efforts, with net leverage down to 4.3x in Q1 2024.

Hurtigruten Group is planning to separate into two independent companies, Hurtigruten and HX Hurtigruten Expeditions, with full separation expected in 2025. The group's EBITDA grew by 204.2% year-over-year, driven by a 449.5% increase in the Hurtigruten segment (56.2% on an adjusted basis). In contrast, HX Hurtigruten Expeditions' EBITDA declined by 219% year-over-year (-82.8% on an adjusted basis). A key factor was the transfer of the MS Otto Sverdrup ship from HX to Hurtigruten, boosting capacity for the Hurtigruten segment. The MS Maud ship will also move from HX to Hurtigruten in October 2024.


Contrasting Fortunes: Wabtec Surges While Farm Machinery Falters
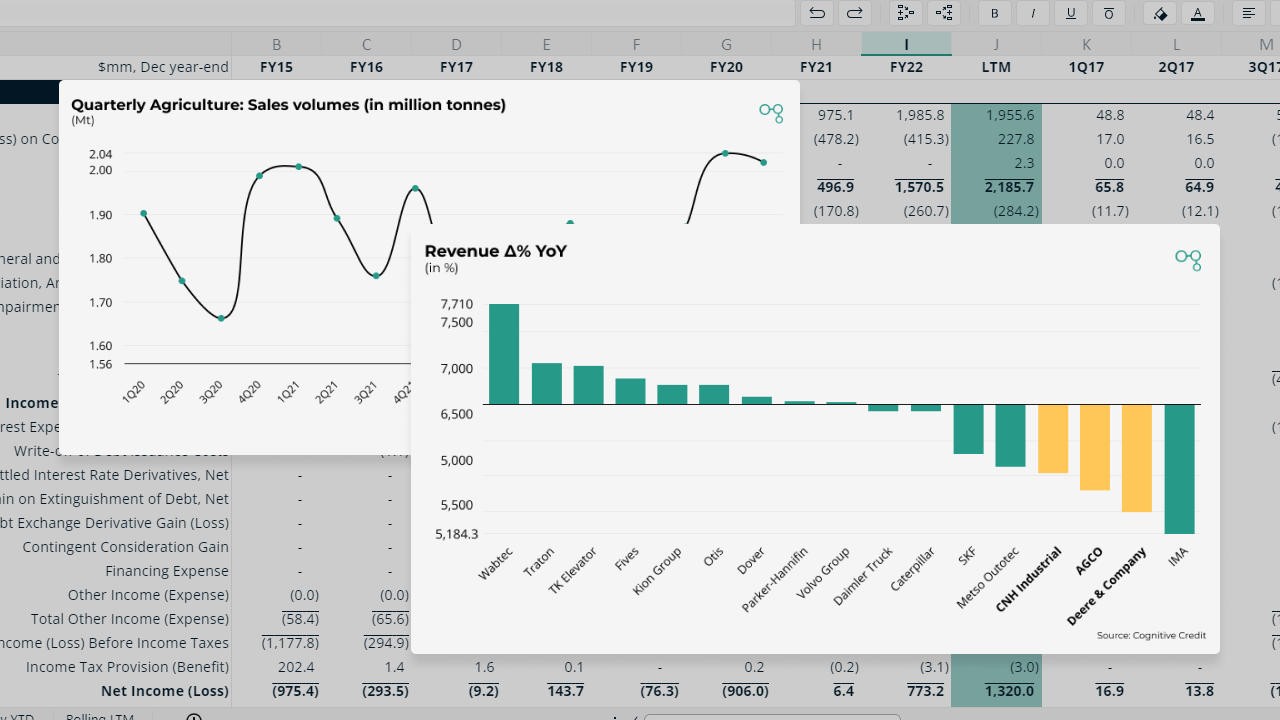
Examining the top line of equipment and machinery providers reveals varying levels of success. Locomotive provider Wabtec has seen a 13.8% year-over-year revenue increase, driven by a robust backlog. In contrast, Agricultural and Farm Machinery providers like CNH, Deere, and AGCO have faced declining revenues due to decreased global demand for agricultural equipment.
Since its acquisition of GE Transportation in the first quarter of 2019, Wabtec has maintained a strong backlog, which has persisted through the first quarter of 2024. Additionally, the company's 12-month backlog has continued to grow, reaching $7,710 million as of March 31, 2024, an 11.3% increase compared to the same period the previous year.

This sustained strong backlog has driven revenue growth for Wabtec, with increases of 17.2% in the Freight segment and 5.5% in the Transit segment.
On the other hand, Agriculture and Farming Machinery providers like CNH, AGCO, and Deere have faced challenges due to declining global demand in the industry. High input cost inflation in Europe and ongoing effects of the conflict in Ukraine have heightened uncertainty and decreased spending in the farming sector. This challenging environment is evident when comparing revenue growth among the machinery companies in our coverage across the Industrial, Construction, and Agricultural & Farm sectors.

Impact Felt in The Chemical Sector: Declining EBITDA Margins Amid Pricing Pressures
These external factors, which have dampened farmer sentiment, are also affecting the chemicals sector. Fertilizer and agricultural chemical providers such as K+S and Yara have seen their LTM EBITDA margins decline further as lower selling prices more than offset reductions in energy costs.

Yara was able to benefit from a decrease in its input costs, with its weighted average gas price falling by 42.9% year-on-year, partially mitigating the impact of declining sales prices. Despite this, ongoing pressures on sales volumes—though showing improvement from their low point in 2022 and early 2023— and the overall negative price pressure continued to drive net leverage higher.


K+S also only managed to partially alleviate revenue challenges facing the industry. Following a prolonged period of inflationary cost pressures, the company benefited from reduced price-related costs in Q1 2024, especially for energy. However, this improvement was insufficient to completely offset the 17.1% year-over-year decline in the company’s revenue. This was primarily driven by a 32.6% year-over-year decline in sales prices as they were able to produce a slight improvement in volumes compared to 2023, with year-over-year growth reaching 16.8%.


1Q24: By the numbers
And to round things off, here’s a quick look at how much earnings data was processed in our European coverage during the 1Q24 earnings cycle:

Analyze the entire market, faster
Cross-market analysis like the above is easy with Cognitive Credit. Our Comparables feature offers a top-down view of all our fundamental data across our four coverage universes (European & US High Yield, and European & US Investment Grade), allowing you to find relative value opportunities across your markets, sectors and companies quickly and conveniently.
To experience our web-app first-hand, sign up for complimentary access here.
