
With the year end’s earnings finishing, our analysts take a look at the data from the latest earnings cycle and identify more interesting observations across European markets and sectors.
As each quarterly earnings cycle ends, we take some time to analyze the enormous amount of data we process with our Comparables feature - a powerful tool to view markets and sectors top down and in their entirety - to see what sector trends jump out at us across our current coverage universes.
Without further delay, here's our Quarterly Earnings Breakdown for FY23 - European Edition.
Results remain solid for shipping despite tumbling freight rates
At first glance it may seem that Marine companies are struggling (Revenue down -9.0% YoY, EBITDA down -18.7% YoY), however this is in fact a return to normality following the post Covid-19 ‘boom’.
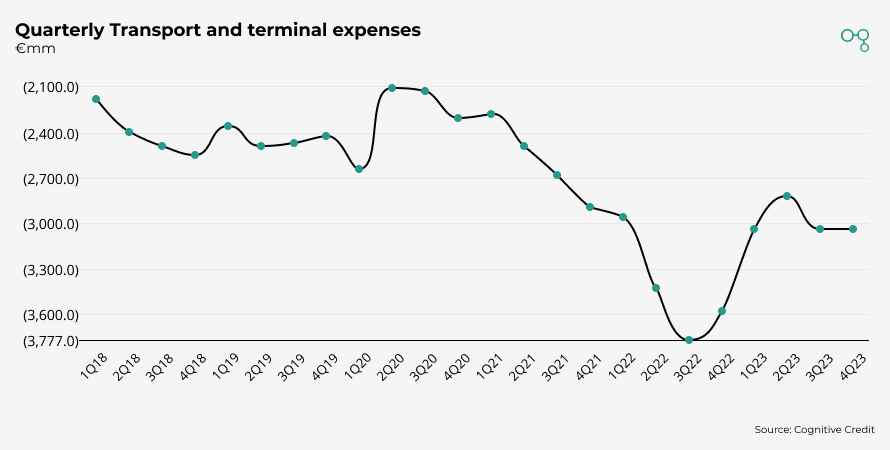
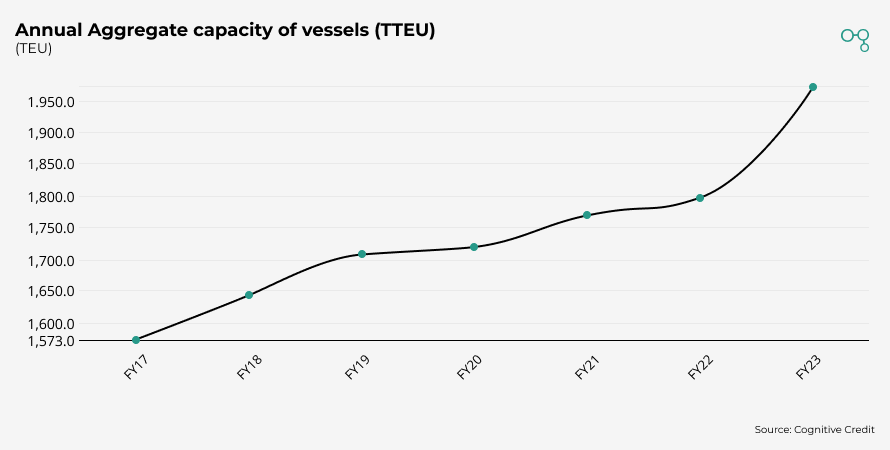
Hapag Lloyd’s container volumes remained similar to the prior year whilst freight rates continued to fall (4Q23 freight rates down -54.7% YoY). Inflationary pressures have kept transportation costs at historically high levels, unable to offset the fall in freight rates, squeezing margins. The firm’s gradual increase in transport capacity illustrates how the industry continues to build fleet, which is likely to negatively impact freight rates in the medium term.
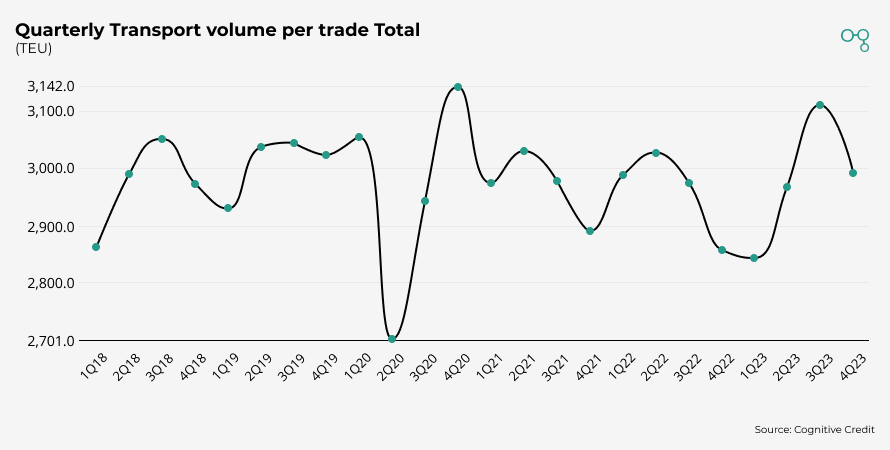
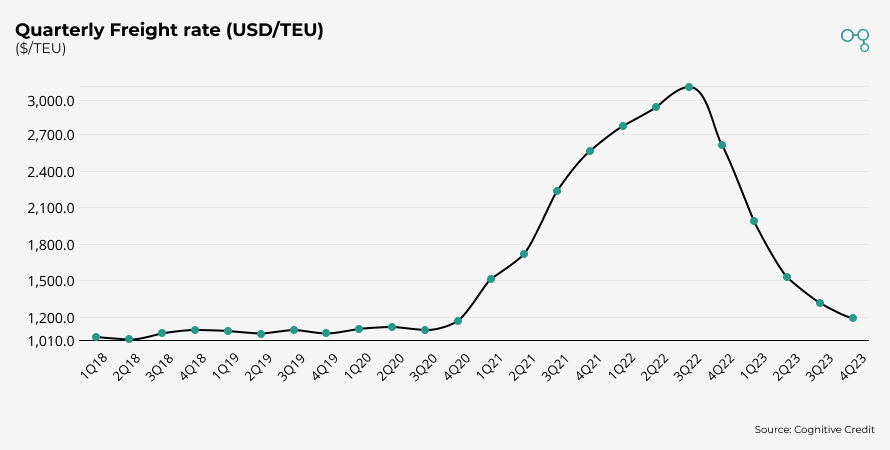
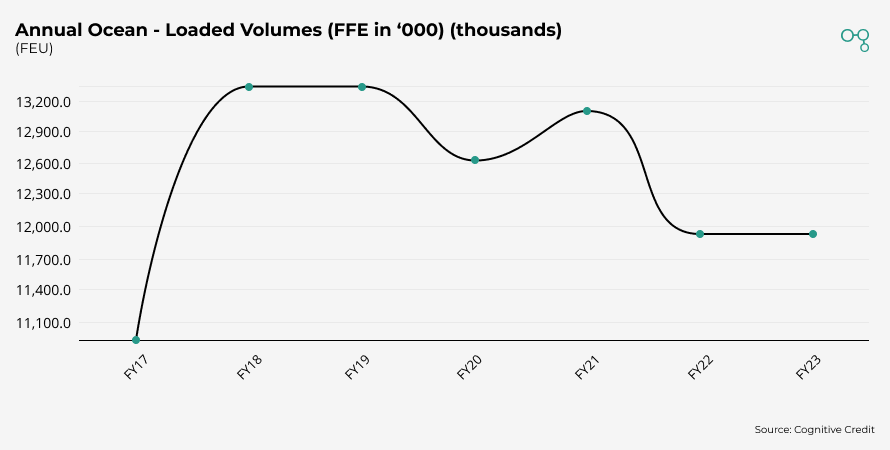
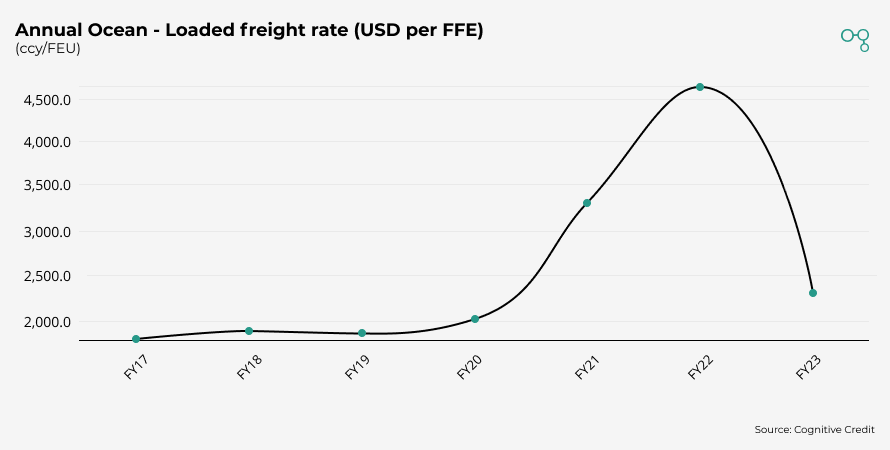
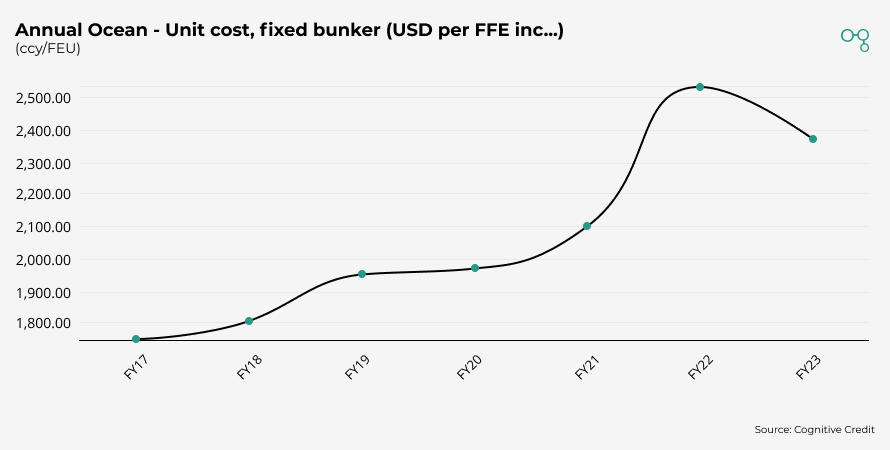
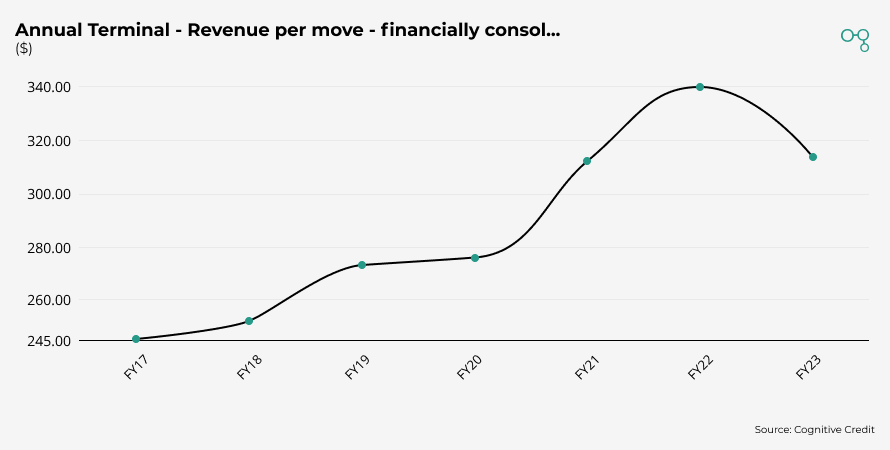
Maersk has experienced a similar trend (Revenue down -37.4% YoY), with annual loaded volumes remaining flat (-0.2% YoY) as loaded freight rates were cut in half. The firm must continue working on its aim to bring costs down to 2019 levels. The firm’s Terminal segment followed the same trend with revenue per move down -8.2% YoY.
These results are still impressive versus pre-pandemic performance, especially as shipping demand continues its current downward trend. It will be interesting to see how the geopolitical environment affects the global shipping routes, particularly in the Red Sea, after the recent vessel strikes and disruption over recent months.
Oil & Gas face a similar trend as energy prices return to normality
Companies within the Oil & Gas sector have faced similar challenges, adapting to market conditions after a spike in energy prices in 2022. This energy crisis was largely caused by Russia leading to record natural gas prices and elevated oil prices.
Diving into BP’s KPIs we can see in its Oil Production & Operations segment, natural gas daily production increased 15.9% YoY in 4Q23, whilst its average price realization fell -64.2% YoY. The same trend is present in the Gas & Low Carbon Energy segment with total hydrocarbon price realizations falling -30.3% YoY, although daily production also fell by -6.6% YoY. This has contributed to a whole firm reduction in revenue of -24.7% YoY in 4Q23. However, the small upward price trend QoQ should stabilize revenues going forward.
.png?width=890&height=450&name=FY23-EU-Quarterly%20Oil%20production%20%26%20operations%20(mmcf-d).png)
.png?width=890&height=450&name=FY23-EU-Quarterly%20Oil%20production%20%26%20operations%20($-mcf).png)
.png?width=890&height=450&name=FY23-EU-Quarterly%20Gas%20%26%20low%20carbon%20energy%20(Mboe-day).png)
.png?width=890&height=450&name=FY23-EU-Quarterly%20Gas%20%26%20low%20carbon%20energy%20($-boe).png)
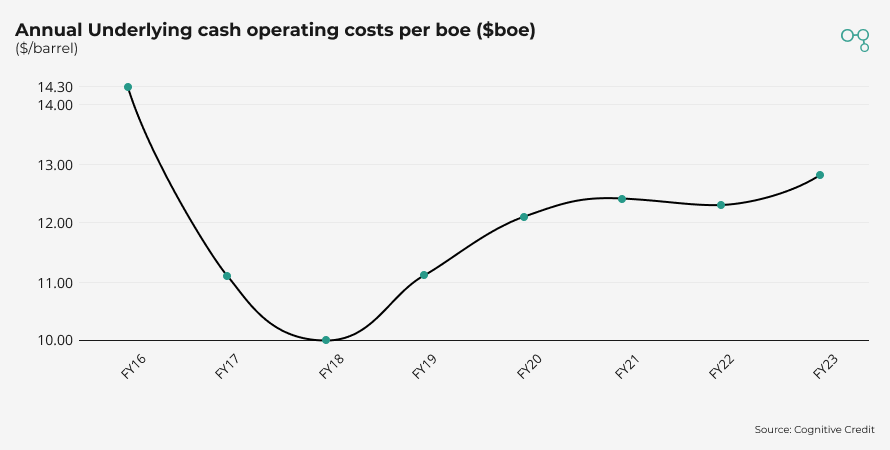
Of course, whilst hydrocarbon prices can rise or fall dramatically, it remains harder for producers to adjust their cost bases to reflect this quickly. This is illustrated by Tullow Oil where underlying cash operating costs per boe have remained high at $12.80 in FY23. Another contributing factor may be that the firm has failed to return to pre-pandemic production levels.
.png?width=890&height=450&name=FY23-EU-Annual%20Production%20(MMboe).png)
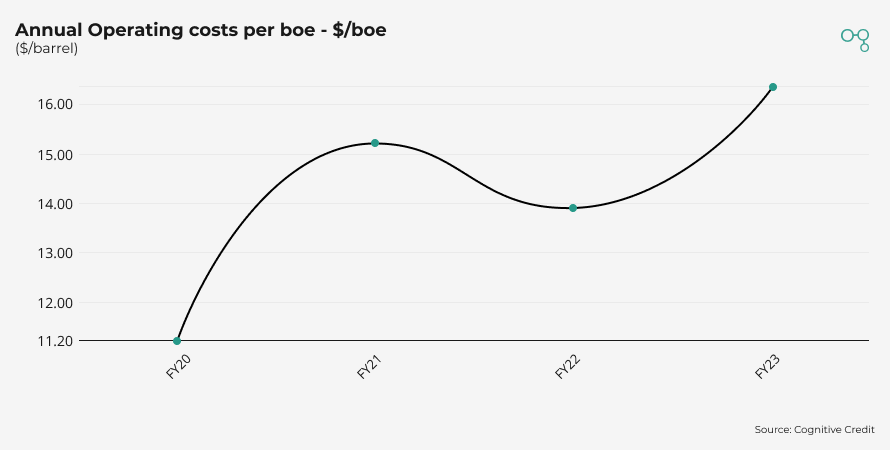
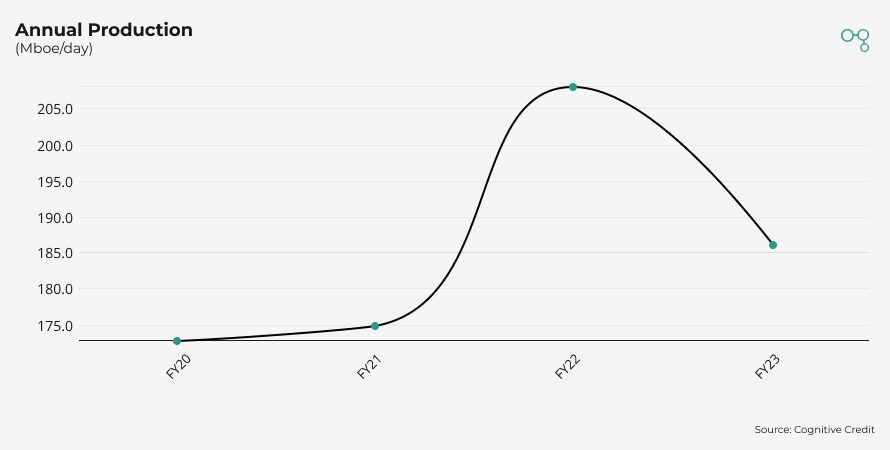
The same can be said for Harbour Energy where operating costs per boe increased 18.0% YoY to $16.40, as daily production fell by -10.6% YoY.
The sector is likely to have a strong start to 2024 as geopolitical tensions in the Middle East cause oil prices to be on the rise once again.
Autos continue post-pandemic recovery
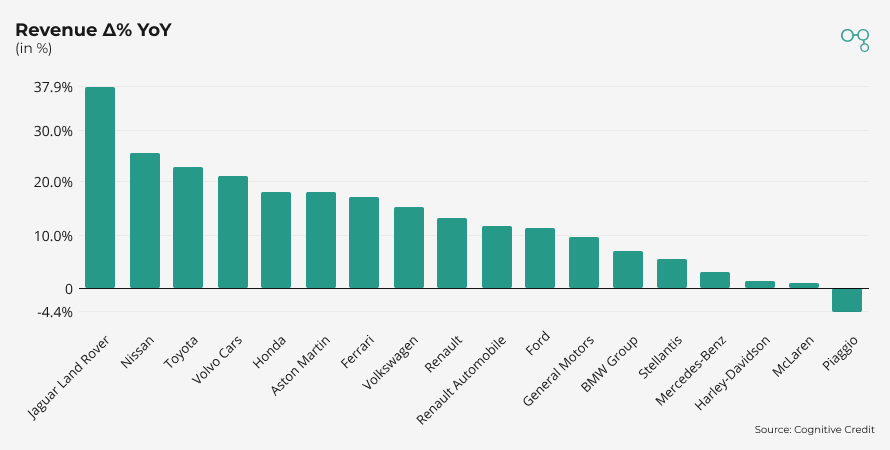
FY23 was a strong year for European automotives (revenue up 13.1% YoY) with all firms experiencing positive revenue growth except for Piaggio. This has been in the face of a higher inflationary period where consumer discretionary income has been squeezed. More expensive consumer financing due to interest rises across Europe make these results even more impressive
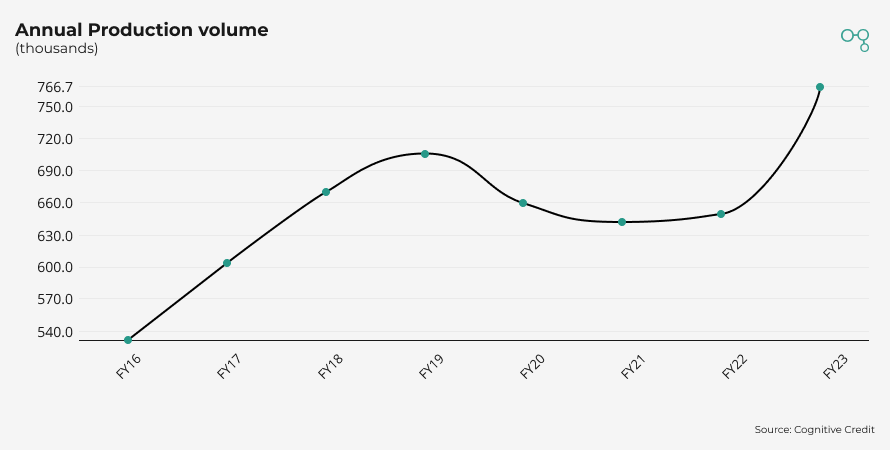
Volvo has actually exceeded their pre-pandemic production volumes, rising to 766.7 (thousand) in FY23 (up 18.2% YoY). The Company’s sales have followed a similar trend with retail sales and wholesale sales up 15.2% and 15.9% YoY respectively.
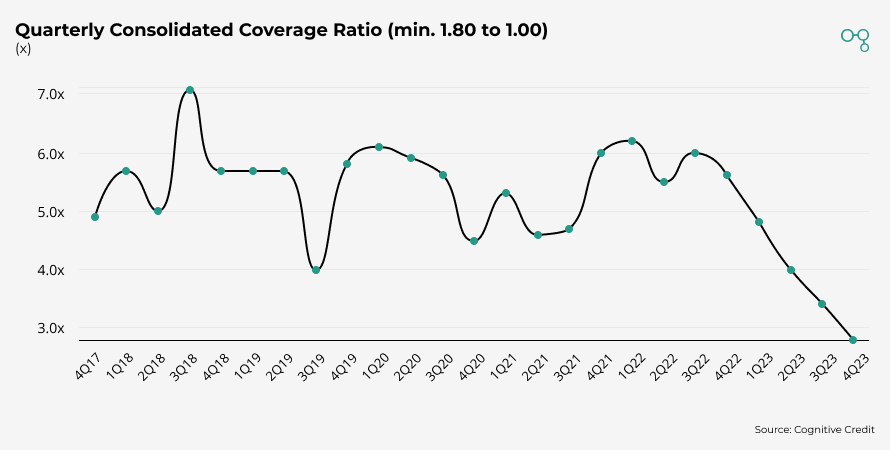
Real Estate firms deal with increased workplace flexibility
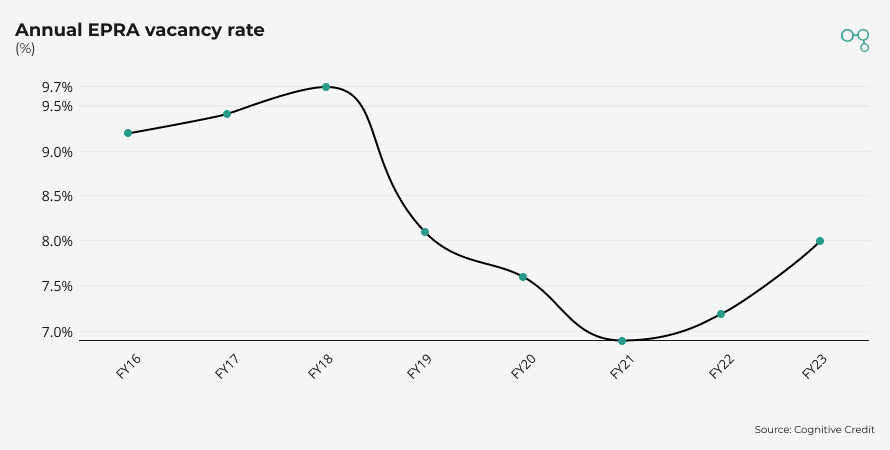
Greater use of flexible working patterns since the pandemic has caused office tenants to re-evaluate their space requirements. As office leases have then come up for renewal some Real Estate firms, particularly Office REITs, are struggling to maintain occupancy rates.
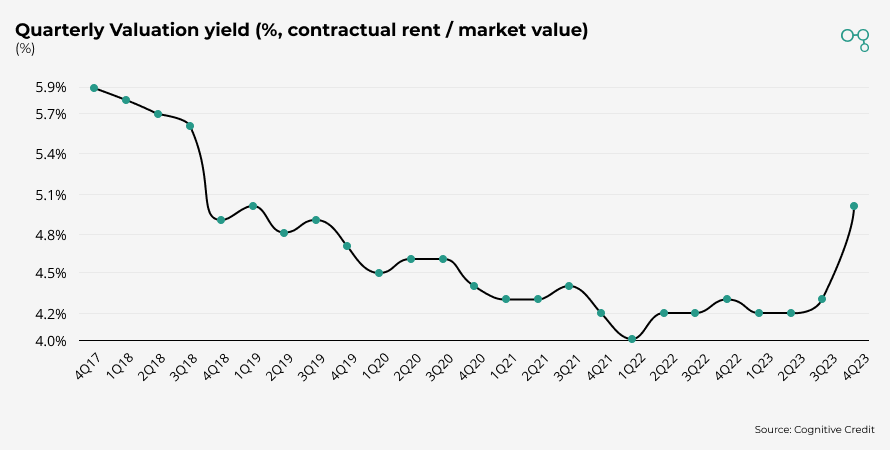
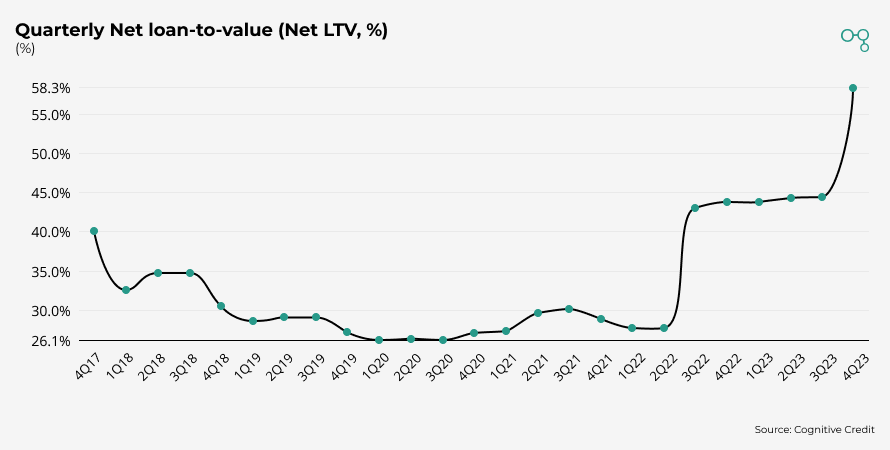
Looking at Alstria, it can be seen that vacancy rates have risen to 8% in FY23. Leading on from our 3Q23 earnings breakdown, the firm has been impacted by a €678m downward revaluation adjustment of its investment property portfolio in 4Q23, as its portfolio is revalued for its audited year-end financial statements. Downward pressure on valuations was driven by higher required yields (up 70bp YoY) and has adversely impacted loan-to-value percentages (up 14.6pp YoY). Alstria’s consolidated coverage ratio has been cut in half to 2.8x.
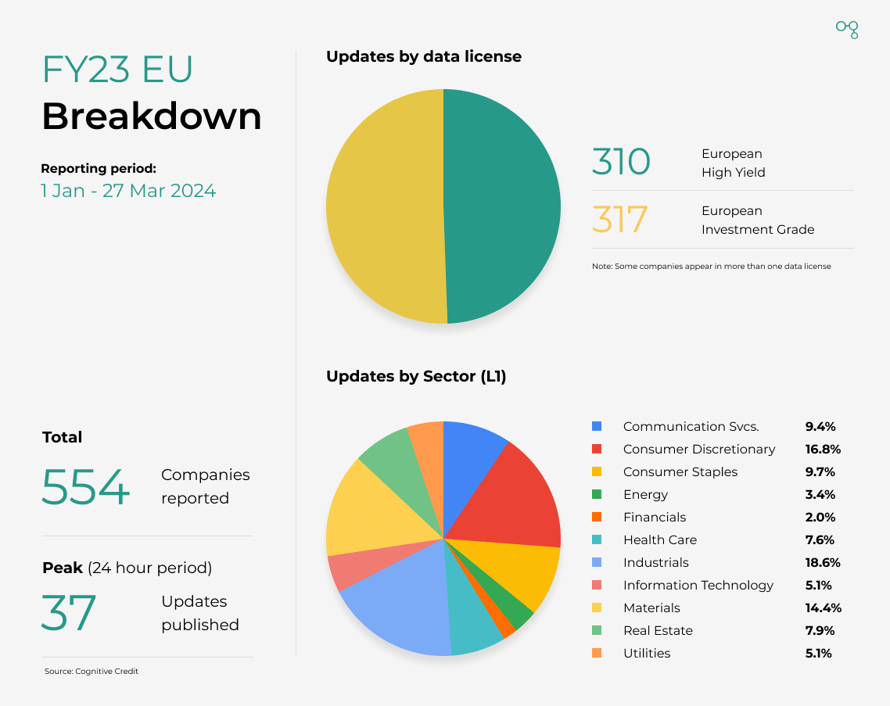
FY23: By the numbers
And to round things off, here’s a quick look at how much earnings data was processed in our European coverage during the FY23 earnings cycle:
Looking ahead
As we enter the first quarter of 2024, it will be interesting to see how the geopolitical unrest in the Middle East will affect a number of sectors. There may be supply chain issues if shipping lanes in the Red Sea are disrupted, whilst oil prices have already seen a rise.
Looking further ahead in the year, investors will be watching for interest rate cuts and how they will alleviate pressures on consumer spending.
Analyze the entire market, faster
Cross-market analysis like the above is easy with Cognitive Credit. Our Comparables feature offers a top-down view of all our fundamental data across our four coverage universes (European & US High Yield, and European & US Investment Grade), allowing you to find relative value opportunities across your markets, sectors and companies quickly and conveniently.
To see our Comparables feature in action, request your demo today.
You might also like
 2 min read
 5 min read
