Our analysts take a look at the data from the 1Q24 earnings cycle and identify more interesting observations across US markets and sectors.
As each quarterly earnings cycle ends, we take some time to analyze the enormous amount of data we process with our Comparables feature - a powerful tool to view markets and sectors top down and in their entirety - to see what sector trends jump out at us across our current coverage universes.
Without further delay, here's our Quarterly Earnings Breakdown for 1Q24 - US Edition.
Only one Semiconductor is carrying a tune
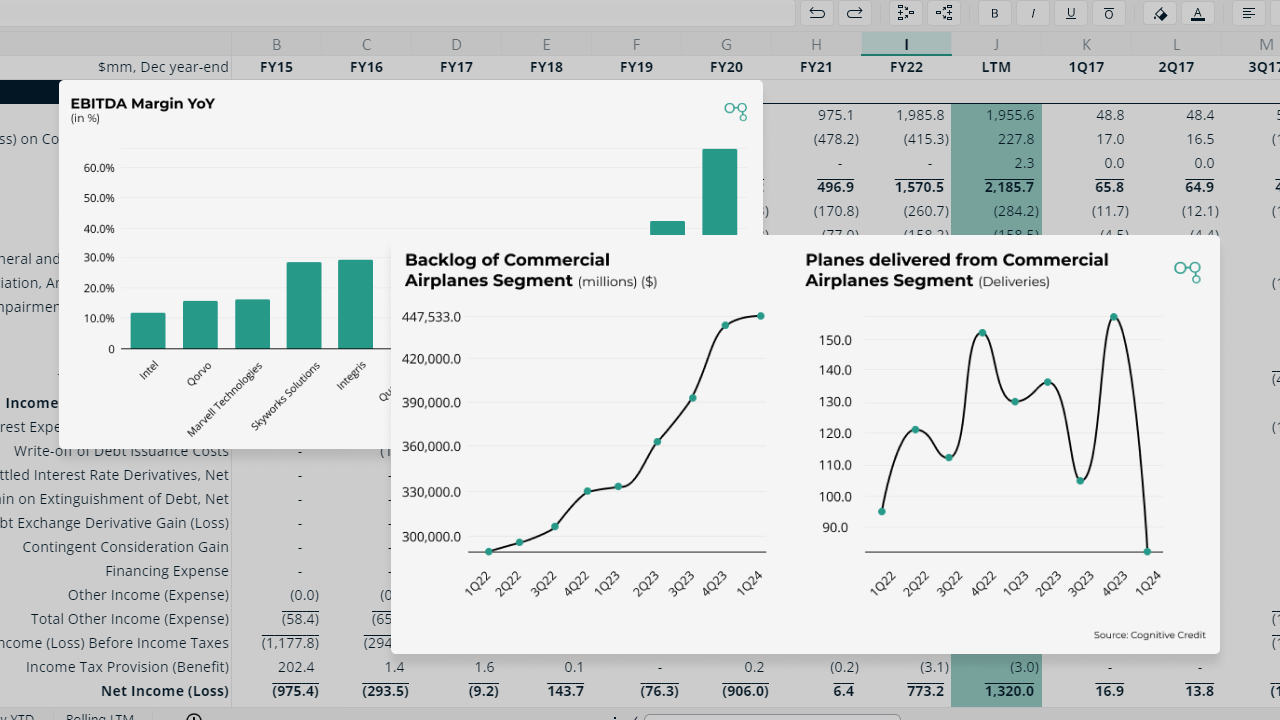
NVIDIA drove the Semiconductor sector's 16.6% YoY revenue growth with a remarkable 261% increase in revenue and 586% growth in EBITDA. Its industry-leading EBITDA margin of 66.5% (compared to the nearest competitor's 42.4%) was fueled by record data center revenue serving enterprise and consumer internet customers.
![]()
![]()
Excluding NVIDIA, the sector's YoY revenue growth was just 1.2%. Many competitors reported reduced demand, leading to revenue declines. While Intel had 8.6% YoY revenue growth, it saw decreased data center and AI segment revenues due to lower volumes.

Spirit haunted by Boeing failures
In our previous US earnings piece, we noted positive YoY revenue growth for all Aerospace and Defense sector companies. This trend continued with US HY and US IG growing by 11.8% and 6.9%, respectively. However, Boeing lagged behind.

Boeing's Commercial Airplanes segment has struggled, despite strong demand reflected in a growing backlog. Deliveries hit a post-COVID low due to a 737 midair blowout in January 2024. However, its Defense, Space & Security, and Global Services segments remained strong.

Spirit Aerosystems reported 19% YoY revenue growth in 1Q24, but YoY EBITDA collapsed due to rising costs. With 83% of its revenue from Boeing and Airbus, Spirit was impacted by Boeing's response to the blowout and new FAA regulations that caused delivery delays. Increased inspections, new product verification processes, and strategic pricing discussions with Airbus drove up costs. (1Q24 Earnings, page 12) Although Spirit delivers more shipsets to Airbus, the Company earns higher revenue per shipset from Boeing, making the delays more detrimental as costs rise.


Lilly begins to flower
In our previous US earnings piece, we highlighted challenges in the Pharmaceutical sector. These issues slightly abated in 1Q24, with Sector average YoY revenue growth of 4.4%. Lilly led our coverage universe with a 26% YoY revenue increase.

Lilly’s 26% growth was “driven by Mounjaro, Zepbound, Verzenio and Jardiance” (Source: 1Q24 Presentation, page 17).


The demand for Tirzepatide, the active compound sold as Zepbound and Mounjaro, has exceeded Lilly's production. To address this, Lilly is increasing its spending on property, plant, and equipment to expand its manufacturing capacity. This investment, which will continue over several years, aims to meet the heightened demand, ensuring a reliable supply of Tirzepatide for patients worldwide. (Source: 1Q24 page 35, 1Q24 Presentation page 17).
Liquid Gold
Overall, revenue rose by 5.6% in the North American Environmental and Facilities space. Aris Water Solutions led this growth with a 12.9% increase in revenue YoY and a 39.4% rise in adjusted EBITDA YoY.


Aris’ strong performance was driven by a 19% increase in produced water volumes and a 31% rise in recycled produced water volumes. Record margins have been achieved due to cost reductions from successful electrification efforts (Source: 1Q24 Prelim, page 1)
1Q24: By the numbers
And to round things off, here’s a quick look at how much earnings data was processed in our US coverage during the FY23 earnings cycle:

Analyze the entire market, faster
Cross-market analysis like the above is easy with Cognitive Credit. Our Comparables feature offers a top-down view of all our fundamental data across our four coverage universes (European & US High Yield, and European & US Investment Grade), allowing you to find relative value opportunities across your markets, sectors and companies quickly and conveniently.
To experience our web-app first-hand, sign up for complimentary access here.

